Descriptive Statistics In Power BI/M With Table.Profile()

As Buck Woody notes here, when you are exploring a new data set it can be useful calculate some basic descriptive statistics. One new M function that appeared in Power BI recently can help you to do this: Table.Profile(). This function takes a value of type table and returns a table that displays, for each column in the original table, the minimum, maximum, average, standard deviation, count of values, count of null values and count of distinct values (but no mode or median?). So, given the following table:

…the Table.Profile() function returns the following table:

Of course you could create something similar yourself fairly easily (as I have done for a customer in the past), and it’s not as sophisticated as the Quick Insights feature, but it’s handy to have a single function that does all this.

You could even use it on all of the tables in a SQL Server database. Since the Sql.Database() function returns a table containing all of the tables and views in a database, like so:

image

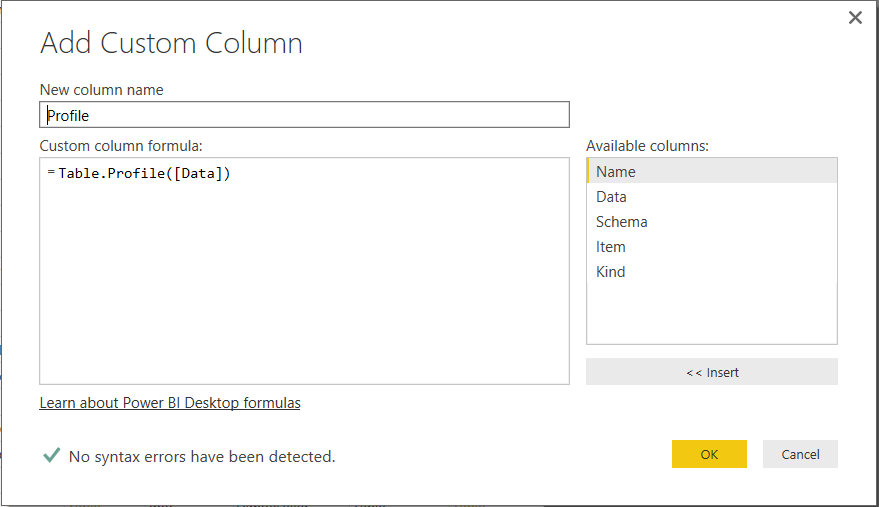
All you need to do to use Table.Profile() on all these tables is to add a new custom column that calls this function for every value in the Data column:

image

Then finally expand the new custom column and you’ll see the stats for every column in every table:

image

Here’s the code:

[sourcecode language=”text” padlinenumbers=”true”]
let
Source = Sql.Database("localhost", "adventure works dw"),
#"Added Custom" = Table.AddColumn(Source, "Profile",
each Table.Profile([Data])),
#"Expanded Profile" = Table.ExpandTableColumn(#"Added Custom",
"Profile",
{"Column", "Min", "Max", "Average", "StandardDeviation", "Count", "NullCount", "DistinctCount"},
{"Column", "Min", "Max", "Average", "StandardDeviation", "Count", "NullCount", "DistinctCount"})
in
#"Expanded Profile"
[/sourcecode]

Two New Books: “The Definitive Guide To DAX” And “’M’ Is For Data Monkey”

I’m not going to pretend that this blog post is a properly impartial review – I know the authors of both of these books to varying degrees – but I thought it was worth writing a few words on two new books I’ve acquired recently which are worth additions to any Power BI enthusiast’s bookshelf or e-reader.

The Definitive Guide To DAX

Something I’ll never understand about my friends Marco Russo and Alberto Russo is their love of writing books – they generally have a new one out every year, sometimes two (personally I find writing books painful). Their latest publication is “The Definitive Guide To DAX” and it does indeed live up to its title. No-one outside the dev team comes close to Marco and Alberto’s knowledge of DAX, the language of Power Pivot, Power BI Desktop modelling and SSAS Tabular, and in this book they have documented everything that they know about it down to the smallest detail. Want to know what the KeepFilters() function does? Or the GenerateAll() function? How about all the new DAX functions and features in the latest versions of Power BI Desktop which will also appear in SSAS 2016 Tabular? They’re all here, and more. As such this is essential purchase for anyone doing serious work on the Microsoft BI platform, although probably more as a reference than a book to read end-to-end. It’s fair to say there’s a certain amount of overlap between this and some of their previous books on Power Pivot and SSAS Tabular, but the language – and the community’s understanding of it – has evolved sufficiently to justify buying this book too.

[I received a free copy of this book for review]

Buy it here from Amazon UK | US

‘M’ Is For Data Monkey

As the author of the only other book on Power Query, I suppose I should really be keeping quiet about “’M’ Is For Data Monkey” in case you buy it instead of mine. However 18 months of UI changes and functionality improvements mean my book is now a bit out-of-date, and what’s more important is that Ken Puls and Miguel Escobar have had the advantage of a lot of real-world experience with Power Query that I didn’t have (indeed no-one had) when I was writing in early 2014. The book itself is not a formal introduction to the M language but a guide to what you can do with it in Power Query; while a lot of what’s here will be useful in Power BI this is definitely a Power Query book and the target audience is Excel Pros rather than BI Pros. The decision to focus on Excel Pros was a good one to make, in my opinion, because it plays to the authors’ strengths and means that the book has a very practical focus. A lot of the tips and tricks here are ones I’ve used successfully myself, and I don’t mind admitting that I learned one or two things from this book as well.

Buy it here from Amazon UK | US

Other Books Are Available…

There are a couple of other new books out that, although I haven’t seen them, will also be worth checking out. Rob Collie has just released Power Pivot and Power BI, essentially the second edition of DAX Formulas For Power Pivot; Matt Allington has just released Learn To Write DAX; both are going to be good choices for Excel users wanting a DAX tutorial. Finally, last week Teo Lachev announced on his blog that he has published the world’s first dedicated Power BI book. Teo is another author whose books I admire so I’m sure it will be excellent, although I’ll be interested to see how he handles the problem of writing about a product that changes so much so quickly.

Power BI Desktop, Sort By Column And DAX Calculations That Use The All() Function

Recently I came across a problem where a DAX measure gave different results in Excel and Power BI Desktop. It turned out not to be a bug or even a feature, but since it confused me for a few minutes I thought it was worth writing up in case anyone else ran into it.

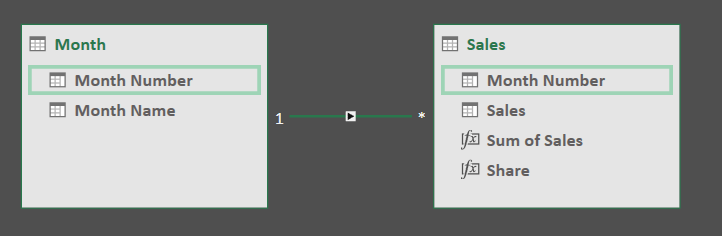
Consider a model built in Excel using Power Pivot from the following two tables:

image

image

With two measures defined in the model as follows:

Sum of Sales:=SUM(Sales[Sales])

Share:=DIVIDE([Sum of Sales], CALCULATE([Sum of Sales], ALL(Month[Month Name])))

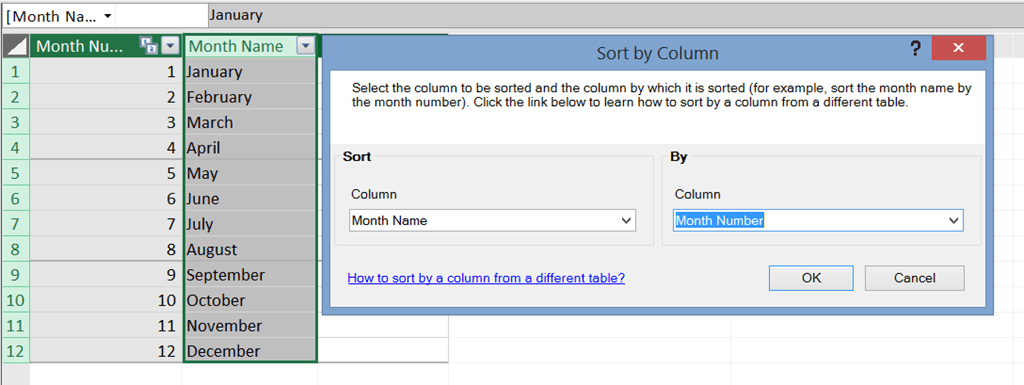
…and, importantly, the Sort By Column property on the Month Name column set to Month Number:

image

…it’s possible to build a PivotTable that looks like this:

image

However, when you import the same model into Power BI Desktop and recreate the PivotTable above in the Report view you’ll see that the Share calculation no longer gives the same values:

image

What’s the problem here? It’s all down to the way Power BI Desktop generates DAX queries when you set the Sort By Column property. The Excel PivotTable above generates the following MDX:

[sourcecode language=”text” padlinenumbers=”true”]
SELECT
{[Measures].[Sum of Sales],[Measures].[Share]}
DIMENSION PROPERTIES PARENT_UNIQUE_NAME,MEMBER_VALUE,
HIERARCHY_UNIQUE_NAME ON COLUMNS ,
NON EMPTY
Hierarchize(
{DrilldownLevel({[Month].[Month Name].[All]},,,INCLUDE_CALC_MEMBERS)})
DIMENSION PROPERTIES PARENT_UNIQUE_NAME,MEMBER_VALUE,
HIERARCHY_UNIQUE_NAME ON ROWS
FROM [Model]
CELL PROPERTIES VALUE, FORMAT_STRING, LANGUAGE,
BACK_COLOR, FORE_COLOR, FONT_FLAGS
[/sourcecode]

On the rows axis, as you would expect, the only hierarchy you see is Month Name.

However, if you run a Profiler trace (you can find out how to do this here although it’s much easier to get the Process ID from DAX Studio) to look at the DAX query generated by Power BI you’ll see

[sourcecode language=”text”]
EVALUATE
TOPN (
102,
SUMMARIZECOLUMNS (
ROLLUPADDISSUBTOTAL (
ROLLUPGROUP ( ‘Month'[Month Name], ‘Month'[Month Number] ),
"IsGrandTotalRowTotal"
),
"Share", ‘Sales'[Share],
"Sum_of_Sales", ‘Sales'[Sum of Sales]
),
[IsGrandTotalRowTotal], 0,
‘Month'[Month Number], 1,
‘Month'[Month Name], 1
)
ORDER BY
[IsGrandTotalRowTotal] DESC,
‘Month'[Month Number],
‘Month'[Month Name]
[/sourcecode]

The difference here is that the Month Number and Month Name fields are both present – they have to be since the query has to sort by Month Number. In MDX the order of members on a hierarchy can be set inside the model; in a DAX query you can only sort using an ORDER BY clause and for that to work, the field you’re ordering by must be present in the query.

The Share measure calculation needs to be changed in order to fix this, then. Here’s one way of doing this:

Share =

DIVIDE([Sum of Sales],

CALCULATE([Sum of Sales], ALL(Month[Month Name], ‘Month'[Month Number])))

Working With Compression In Power Query And Power BI Desktop

If you’re reading this post there’s one important question you’ll probably want to ask: is it possible to extract data from a zip file in Power Query/Power BI? The answer is, unfortunately, no (at least at the time of writing). As this answer from Tristan on the dev team explains, because there are so many flavours of zip file out there it’s an extremely difficult problem to solve – so it hasn’t been attempted yet. That said, there are two other mildly interesting things to learn about compression in Power Query/Power BI Desktop that I thought were worth blogging about…

The first is that Power Query/Power BI can work with gzip files. For example, given a gzip file that contains a single csv file, here’s an example M query showing how the Binary.Decompress() function can be used to extract the csv file from the gzip file and then treat the contents of the csv file as a table:

[sourcecode language=”text” padlinenumbers=”true”]
let
Source = Binary.Decompress(
File.Contents(
"C:\Myfolder\CompressedData.csv.gz"),
Compression.GZip),
#"Imported CSV" = Csv.Document(Source,
[Delimiter=",",Encoding=1252]),
#"Promoted Headers" = Table.PromoteHeaders(#"Imported CSV"),
#"Changed Type" = Table.TransformColumnTypes(
#"Promoted Headers",{
{"Month", type text}, {" Sales", Int64.Type}
})
in
#"Changed Type"
[/sourcecode]

The other is that you’ll see Binary.Decompress() used when you import an Excel workbook that contains a linked table into Power BI Desktop. For example, consider an Excel workbook that contains the following table:

image

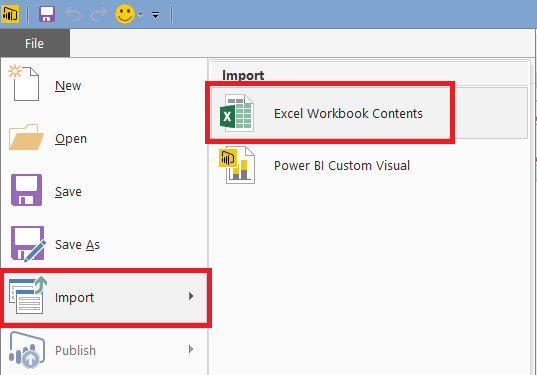
If this table is imported into the Excel Data Model as a linked table, and you then save the workbook and try to import it into Power BI using File/Import/Excel Workbook Contents:

image

… you’ll see this message:

image

Click Start and you’ll get another message:

image

If you choose the Copy Data option, the data from the Excel table will be copied into Power BI. But where is it stored exactly? A look in the Query Editor at the query that returns the data shows that it’s embedded in the M code itself:

[sourcecode language=”text”]
let
Source = Table.FromRows(
Json.Document(
Binary.Decompress(
Binary.FromText(
"i45WMlTSUTJSitWJVjIGskzALFMgy0wpNhYA",
BinaryEncoding.Base64),
Compression.Deflate)),
{"A","B"}),
#"Changed Type" = Table.TransformColumnTypes(
Source,{{"A", Int64.Type}, {"B", Int64.Type}})
in
#"Changed Type"
[/sourcecode]

That big chunk of text in the middle of the Source step is the data from the Excel table stored as a compressed JSON document, and again Binary.Decompress() is used to extract this data.

The Text.Format() Function In Power BI/Power Query M

New functions are appearing in M all the time, many with no announcement or documentation. I came across Text.Format() the other day and I thought it was worth blogging about because I can see a lot of uses for it: it makes it very easy to insert values into a piece of text.

The function signature is:
Text.Format(formatString as text, arguments as any, optional culture as nullable text)

Here’s a simple example:

Text.Format(“The #[Animal] sat on the #[Furniture]”, [Animal=”cat”, Furniture=”mat”])

It returns the text:

The cat sat on the mat

image

As you can see, the references to each record field in the first piece of text are replaced with the values from those fields from the record in the second parameter. Those of you who know a little M will realise how this works: the placeholder in the text passed to the first parameter is actually the same M expression you would use to extract the value you need from the record in code. So [Animal] is the M expression you’d use to return the value from the Animal field from the record [Animal=”cat”, Furniture=”mat”], as in following expression which returns the text value “cat”:

[sourcecode language=”text”]
let
MyRecord = [Animal="cat", Furniture="mat"],
GetAnimal = MyRecord[Animal]
in
GetAnimal
[/sourcecode]

The second parameter can take other data types too. You can pass a list instead of a record; so for example the expression

Text.Format(

“The first number is #{0}, the second number is #{1}, the third number is #{2}”,

{5,8,9})

returns the text

The first number is 5, the second number is 8, the third number is 9

The optional third parameter of Text.Format() controls the locale/culture used when formatting the values. So for example the expression

Text.Format(

“Decimal example #{0} – Date example #{1}”, {100.001, #date(2015,12,1)},

“en-us”)

returns a decimal number and date formatted for US English, with a full stop (or period, as the Americans say) as the decimal separator and the date shown as mm/dd/yyyy:

Decimal example 100.001 – Date example 12/1/2015

While the expression

Text.Format(

“Decimal example #{0} – Date example #{1}”, {100.001, #date(2015,12,1)},

“fr-fr”)

Returns the same values formatted for French/France, where the decimal separator is a comma and dates are formatted dd/mm/yyy:

Decimal example 100,001 – Date example 01/12/2015

How about some more advanced examples? Here’s a table in Excel:

image

If you load it into Power Query and then create a custom column, in your custom column expression you can refer to the current row as a record using the _ (underscore) character. So creating a custom column using the following expression:

Text.Format(“the #[Animal] sat on the #[Furniture]”, _)

image

Returns a table that looks like this:

image

You could also use Text.Format() to create parameterised queries to run against a database. Here’s an example of an MDX query on the Adventure Works DW database with a parameterised WHERE clause:

[sourcecode language=”text” padlinenumbers=”true”]
let
MDXQueryTemplate =
"SELECT#(lf)
{[Measures].[Internet Sales Amount]} ON 0,#(lf)
NON EMPTY#(lf)
[Date].[Calendar Year].[Calendar Year].MEMBERS ON 1#(lf)
FROM#(lf)
[Adventure Works]#(lf)
WHERE(
STRTOMEMBER(
""[Customer].[Country].&[#[Country]]"",
CONSTRAINED))",
ReplaceCountryParameter =
Text.Format(
MDXQueryTemplate,
[Country="Australia"]),
RunQuery =
AnalysisServices.Database(
"localhost",
"adventure works dw 2008",
[Query=ReplaceCountryParameter])
in
RunQuery
[/sourcecode]

Remember, if you do something like this you’ll probably want to disable native database prompts – if you don’t, you’ll be asked to approve every new query that gets run. Also, you’ll notice that I’m using the StrToMember() function with the Constrained flag in the WHERE clause because, even though it’s not really necessary, it’s good from a security point of view. It would be really good if we could use proper MDX parameters in our queries but I don’t think it’s possible, unless there’s some other new feature or function that I don’t know about.

New SSAS, Power BI And SQL Server Training Courses For 2016

I’ve just added a number of new 2016 training course dates to the Technitrain site. If you’re looking for Power BI, Analysis Services, SQL Server or Data Science training in London then please check them out! Also, if you’d like to sign up for the Technitrain newsletter to stay up-to-date with our news you can do so here.

Here are more details on the new courses:

SQL Server Performance Tuning and Internals Boot Camp, Bradley Ball, 15-19 February 2016, London
This 5-day hands-on course is designed to provide DBAs with the tools and knowledge that are required to keep their SQL Servers running efficiently and reliably.
http://technitrain.com/coursedetail.php?c=60&trackingcode=CWB

Introduction To Power BI, Chris Webb, 22-23 February 2016, London
A two-day introduction to Microsoft’s exciting new BI tool suitable for BI professionals, analysts, report developers or anyone interested in using it to build reports or dashboards.
http://technitrain.com/coursedetail.php?c=65&trackingcode=CWB
 
Real World Cube Design And Performance Tuning With SSAS Multidimensional,  Chris Webb, 11-13 April 2016, London
A course aimed at intermediate-to-experienced Analysis Services Multidimensional developers, looking at more advanced cube design topics and query performance tuning.
http://technitrain.com/coursedetail.php?c=66&trackingcode=CWB

Mastering DAX, Marco Russo, 20-22 June 2016, London
A three-day introduction to the DAX language used by Power BI, Analysis Services Tabular models and Power Pivot.
http://technitrain.com/coursedetail.php?c=63&trackingcode=CWB

Optimising DAX, Marco Russo, 23-24 June 2016, London
An advanced two-day course for experienced DAX developers who wish to learn how to optimise DAX calculations and queries for performance.
http://technitrain.com/coursedetail.php?c=64&trackingcode=CWB

Introduction to MDX, Chris Webb, 4-6 July 2016, London
A three day course designed for those with little or no experience of MDX, this course will teach you how to write MDX queries and calculations for Analysis Services.
http://technitrain.com/coursedetail.php?c=67&trackingcode=CWB
 
Practical Data Science with Cortana Analytics, Rafal Lukawiecki, 24-27 October 2016, London
This course is aimed at analysts, analytical power users, predictive developers, BI power users and developers, budding data scientists and consultants.
http://technitrain.com/coursedetail.php?c=68&trackingcode=CWB

Using Parameter Tables To Control Data Refresh In Power BI

The use of parameter tables is a well-known technique in Power Query. It involves using a table from the current Excel workbook to hold various parameter values that are read using a Power Query query, and these parameter values are then passed to another Power Query query to control how it behaves. Ken Puls has a great post describing all this here, and similarly a lot of the demos in my video on on building a reporting solution in Power Query involve reading values from a table which are then used to filter data in a SQL query.

The problem with Power BI Desktop and PowerBI.com is that without a current Excel workbook there’s nowhere to store parameter values (at least at the moment) so you can’t implement the technique in exactly the same way. However, with a bit of creativity, it is possible to do something very similar.

Consider the following M query that gets all the rows from the DimDate table in the Adventure Works DW SQL Server database where the day name is Tuesday.

[sourcecode language=”text” padlinenumbers=”true”]
let
Source = Sql.Database("localhost", "adventure works dw"),
dbo_DimDate = Source{[Schema="dbo",Item="DimDate"]}[Data],
#"Filtered Rows" = Table.SelectRows(
dbo_DimDate,
each ([EnglishDayNameOfWeek] = "Tuesday"))
in
#"Filtered Rows"
[/sourcecode]

From this you can build a report in Power BI Desktop that looks something like this:

image

The question is, in this case, how can you make this dynamic and allow your end users to enter a different day name to filter by, and how can you ensure that this dynamic filtering works even when the report has been deployed to PowerBI.com?

There may not be a current workbook to store parameters but in PowerBI.com you can of course display Excel workbooks stored in OneDrive for Business as reports (full details on how to do this are here). Rather than display an Excel report, you can instead display a workbook containing an Excel table containing a day name:

image

This is going to be your parameter table. First minor irritation: while it seems like you can change the value in the table inside PowerBI.com the value doesn’t get saved; you have to use the Edit option to open the workbook in Excel Online before any changes you make do get saved.

image

image

The next problem is this: how can you read the day name parameter value from a table stored in an Excel workbook in OneDrive For Business? It’s actually possible using the Excel Services OData API and I blogged about how to call this API in Power Pivot a few years ago here. With a workbook called FilterParameter.xlsx and an Excel table called FilterDay, here’s an example M query that reads the day name parameter value:

[sourcecode language=”text”]
let
Source = OData.Feed("https://enteryourdomainhere-my.sharepoint.com/_vti_bin/ExcelRest.aspx/personal/chris_enteryourdomainhere_onmicrosoft_com/Documents/FilterParameter.xlsx/OData/FilterDay"),
#"0" = Source{[excelRowID=0]}[Enterparametervalue]
in
#"0"
[/sourcecode]

If this M query is called DayFilter, then the value it returns can be used in the original query to make the filter dynamic (you will also need to set your data privacy levels correctly or enable Fast Combine):

[sourcecode language=”text”]
let
Source = Sql.Database("chriszbook", "adventure works dw"),
dbo_DimDate = Source{[Schema="dbo",Item="DimDate"]}[Data],
#"Filtered Rows" = Table.SelectRows(
dbo_DimDate,
each ([EnglishDayNameOfWeek] = DayFilter))
in
#"Filtered Rows"
[/sourcecode]

image

At this point you’ll have something that works in Power BI Desktop, but there’s still more to do to make this work after the report has been published to PowerBI.com. For a start you’ll need to make sure you’re using the latest version of the Power BI Personal Gateway and that you have enabled Fast Combine in it by following the instructions in this blog post. You also need to make sure that in PowerBI.com, when you set up the credentials for the OData connection to the Excel table, you use the OAuth2 Authenication Method option:

image

And with that, you’re done. You can edit the Excel workbook to change the day name that you want to filter by, and to refresh your report in PowerBI.com you can use the Refresh Now option on the dataset:

image

While dashboards reflect the updated data automatically, if you’re looking at a report you may also need to use the Refresh button on the top of the report to see updated data:

image

And there you have it: a parameter table in PowerBI.com. To be honest, I think there are slightly too many fiddly steps for users to follow in this technique for me to be happy recommending its use unconditionally, but it should be useful in some scenarios. Hopefully there will be an easier way of accomplishing the same thing in Power BI in future…

Webinar Recording: Is OLAP Dead?

Yesterday I presented a webinar for the nice people at Pyramid Analytics, the first of two. I was paid for it of course (I have to earn a living somehow, you know), but the main reason I agreed to do it was because they wanted me to discuss interesting Microsoft BI questions rather than just demo their product – which is, as I’ve said here before, the most effective way of doing tech marketing in my opinion. In any case Pyramid Analytics is one of a small number of third-party tools I’m happy to recommend to my customers even without being paid.

Today’s discussion was on the topic of whether OLAP is dead and you can watch the recording here: https://www.brighttalk.com/webcast/13401/178899 [free sign-up required]

You won’t be surprised to find out that I don’t think OLAP is dead. By “OLAP” I mean the idea of a centralised model containing not just all your data but also things like how your tables should be joined, how measures aggregate up, advanced calculations and KPIs and so on. Using this definition both SSAS Multidimensional and SSAS Tabular are OLAP; I would say both pass the FASMI test for sure. The opposite of OLAP is of course the recently-fashionable self-service BI approach of tools like Power Pivot where every end user can create their own model, which is certainly more flexible but also less easily maintainable, leads to duplication of effort and data, and can be a problem for less technically-able end users. Both a single centralised OLAP model and a distributed self-service approach are useful in different circumstances and the latter certainly doesn’t replace the former. One of the reasons why I’m such a fan of Microsoft’s new direction with Power BI is that it recognises this fact.

The other big question that came up was what the relative strengths and weaknesses of SSAS Multidimensional and Tabular are. Before the webinar I ran a Twitter poll asking people whether they had used Multidimensional or Tabular on the last SSAS project that had worked on; from 151 responses, 48% said Tabular and 52% said Multidimensional. This even split doesn’t surprise me to be honest, based on my own experiences: both flavours of SSAS have different strengths and weaknesses and choosing between them can be very difficult. I’m sure new features like bi-directional cross-filtering and the improved development experience in SSAS Tabular 2016 will increase Tabular’s popularity in the future. Personally, I think if Microsoft were able to offer equivalent functionality to:

  • Calculated members on non-measures dimensions
  • MDX SCOPE statements
  • Parent/child hierarchies (without the performance penalties)
  • Writeback

…in SSAS Tabular then there would be very few good reasons to choose SSAS Multidimensional for new projects.

First Look At SSAS 2016 MDX On DirectQuery

Following on from my last post covering DirectQuery in Power BI, I thought it might be interesting to take a look at the way MDX queries are supported in SSAS Tabular 2016 CTP3 DirectQuery mode.

There were a lot of limitations when using DirectQuery in SSAS Tabular 2012/4, but for me the showstopper was the fact that it only worked if you were running DAX queries against your model. Historically the only major client tool that generated DAX queries to get data was Power View, and Power View was/is too limited for serious use, so that alone meant that none of my customers were interested in using DirectQuery. Although we now have Power BI Desktop and PowerBI.com, which also generate DAX queries, the fact remains that the vast majority of business users will still prefer to use Excel PivotTables as their primary client tool – and Excel PivotTables generate MDX queries. So, support for MDX queries in DirectQuery mode in SSAS 2016 means that Excel users will now be able to query a Tabular model in DirectQuery mode. This, plus the performance improvements made to the SQL generated in DirectQuery mode, means that it’s now a feature worth considering in scenarios where you have too much data for SSAS Tabular’s native in-memory engine to handle or where you need to see real-time results.

At the time of writing the most recent release of SQL Server 2016 is CTP3. If you want to test out the BI features in SQL Server 2016 CTP3 in an Azure VM, I highly recommend Dan English’s blog post here showing how to set one up. To test DirectQuery mode you need to use the older 1103 compatibility mode for your project and not the latest 1200 compatibility mode. This is documented in the release notes:
https://msdn.microsoft.com/en-us/library/dn876712.aspx#bkmk_2016_ctp3_0

image

Once you’ve created your project, you can enable DirectQuery mode in the same way as in previous versions by following the instructions here. The DirectQueryMode property on Model.bim needs to be set to On, and the QueryMode property on the project should be set to DirectQuery.

For testing purposes I downloaded the 2016 version of the Adventure Works DW database and restored it to SQL Server, then created a SSAS Tabular model containing only the DimDate table to keep things simple. I created one measure in the model with the following definition:
TestMeasure:=COUNTROWS(‘DimDate’)

First of all, I ran the following MDX query:

[sourcecode language='text'  padlinenumbers='true']
SELECT
{[Measures].[TestMeasure]} 
ON 0,
[DimDate].[CalendarYear].[CalendarYear].MEMBERS 
ON 1
FROM
[Model]
[/sourcecode]

image

Using a Profiler trace (yes, I know I should be using XEvents but Profiler is so much more convenient for SSAS) I could see the SQL generated by SSAS in the Direct Query Begin and Direct Query End events. For the MDX query above there were three SQL queries generated. The first looks like it is getting the list of years displayed on the Rows axis:

[sourcecode language='text' ]
SELECT 
TOP (1000001) [t0].[CalendarYear] AS [c15]
FROM 
(
  (SELECT [dbo].[DimDate].* FROM [dbo].[DimDate])
)
AS [t0]
GROUP BY [t0].[CalendarYear] 
[/sourcecode]

The second SQL query gets the measure value requested:

[sourcecode language='text' ]
SELECT 
TOP (1000001) [t0].[CalendarYear] AS [c15],
COUNT_BIG(*)
AS [a0]
FROM 
(
  (SELECT [dbo].[DimDate].* FROM [dbo].[DimDate])
)
AS [t0]
GROUP BY [t0].[CalendarYear] 
[/sourcecode]

The third is simply a repeat of the first query.

However, there’s one important thing to say here: there are going to be significant changes and improvements to the SQL generated before RTM, so don’t read too much into the queries shown here.

There are several limitations in CTP3 that may or may not remain at RTM. One that you may run into is the that you can only use fully qualified MDX unique names in your queries, so

[DimDate].[CalendarYear].&[2010]

…will work but

[2010]

…will not. To be honest, I consider it a best practice to use fully qualified unique names anyway so I’m not too bothered about this. Drillthrough doesn’t work at the moment either.

MDX calculations defined in the WITH clause of a query are supported, which is really useful if you’re writing custom MDX queries for SSRS. For example the following query works and generates the same SQL (though with a few more executions) as the previous query:

[sourcecode language='text' ]
WITH
MEMBER [Measures].[TestMDXCalcMeasure] AS 
SUM(NULL:[DimDate].[CalendarYear].CURRENTMEMBER,
[Measures].[TestMeasure])

SELECT
{[Measures].[TestMeasure],
[Measures].[TestMDXCalcMeasure]} 
ON 0,
[DimDate].[CalendarYear].[CalendarYear].MEMBERS 
ON 1
FROM
[Model]
[/sourcecode]

image

All in all, this looks like a solid piece of work by the SSAS dev team. Go and test it! I would love to hear from anyone with genuinely large amounts of data (maybe APS/PDW users?) regarding their experiences with 2016 DirectQuery. Recently I’ve been working with a customer using SSAS Multidimensional in ROLAP mode on top of Exasol and I’ve been surprised at how well it works; I would imagine that 2016 DirectQuery and APS would be an even better combination.

One last thought. If we get the ability to query a cloud-based Power BI mode with MDX and MDX on DirectQuery is supported in Power BI too, why would you bother paying for an expensive SQL Server Enterprise/BI Edition licence plus hardware to use DirectQuery when you can get almost the same functionality in the cloud for a fraction of the price?

Power BI DirectQuery Mode: Not Just SSAS DirectQuery v2.0

When DirectQuery mode for Power BI was announced I assumed it was just the next version of SSAS Tabular DirectQuery mode with the same extra features that we’ll get in SSAS 2016 (such as better SQL generation, and other benefits enabled by Super-DAX). If it was just that I would have been happy, but there’s something else that was mentioned in Miguel’s video introducing the feature that I almost missed, something that is also hinted at in the documentation where it mentions the following limitation:

If the Query Editor query is overly complex an error will occur. To remedy the error you must: delete the problematic step in Query Editor, or Import the data instead of using DirectQuery

It turns out that Power BI in DirectQuery mode is actually SSAS DirectQuery version 2.0 combined with Power Query/Power BI “Get Data”’s query folding capabilities (where the logic in your queries is pushed back to the data source rather than evaluated inside Power BI) – which is quite interesting.

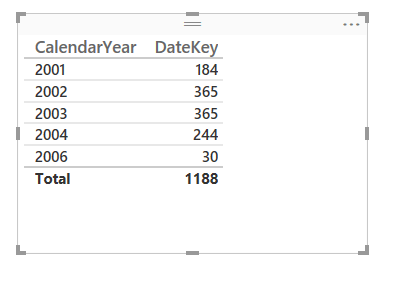
Let’s look at an example using the Adventure Works DW database and SQL Server. If you import just the DimDate table in DirectQuery mode and create a table that shows the count of values from the DateKey column grouped by CalendarYear, like this:

image

The following SQL will be generated:

[sourcecode language='text'  padlinenumbers='true']
SELECT 
TOP (1000001) [t0].[CalendarYear] AS [c15],
COUNT_BIG([t0].[DateKey])
 AS [a0]
FROM 
(
(select [$Table].[DateKey] as [DateKey],
    [$Table].[FullDateAlternateKey] as [FullDateAlternateKey],
    [$Table].[DayNumberOfWeek] as [DayNumberOfWeek],
    [$Table].[EnglishDayNameOfWeek] as [EnglishDayNameOfWeek],
    [$Table].[SpanishDayNameOfWeek] as [SpanishDayNameOfWeek],
    [$Table].[FrenchDayNameOfWeek] as [FrenchDayNameOfWeek],
    [$Table].[DayNumberOfMonth] as [DayNumberOfMonth],
    [$Table].[DayNumberOfYear] as [DayNumberOfYear],
    [$Table].[WeekNumberOfYear] as [WeekNumberOfYear],
    [$Table].[EnglishMonthName] as [EnglishMonthName],
    [$Table].[SpanishMonthName] as [SpanishMonthName],
    [$Table].[FrenchMonthName] as [FrenchMonthName],
    [$Table].[MonthNumberOfYear] as [MonthNumberOfYear],
    [$Table].[CalendarQuarter] as [CalendarQuarter],
    [$Table].[CalendarYear] as [CalendarYear],
    [$Table].[CalendarSemester] as [CalendarSemester],
    [$Table].[FiscalQuarter] as [FiscalQuarter],
    [$Table].[FiscalYear] as [FiscalYear],
    [$Table].[FiscalSemester] as [FiscalSemester]
from [dbo].[DimDate] as [$Table])
)
 AS [t0]
GROUP BY [t0].[CalendarYear] 
[/sourcecode]

Then, if you go to Edit Queries and set a filter on EnglishDayNameOfWeek so that you only get the dates that are Fridays, like so:

image

The click Close And Apply, you’ll see that the table now shows the count of dates in each year that are Fridays (as you would expect):

image

…and the SQL generated also reflects that filter:

[sourcecode language='text'  highlight='27']
SELECT 
TOP (1000001) [t0].[CalendarYear] AS [c15],
COUNT_BIG([t0].[DateKey])
 AS [a0]
FROM 
(
(select [_].[DateKey],
    [_].[FullDateAlternateKey],
    [_].[DayNumberOfWeek],
    [_].[EnglishDayNameOfWeek],
    [_].[SpanishDayNameOfWeek],
    [_].[FrenchDayNameOfWeek],
    [_].[DayNumberOfMonth],
    [_].[DayNumberOfYear],
    [_].[WeekNumberOfYear],
    [_].[EnglishMonthName],
    [_].[SpanishMonthName],
    [_].[FrenchMonthName],
    [_].[MonthNumberOfYear],
    [_].[CalendarQuarter],
    [_].[CalendarYear],
    [_].[CalendarSemester],
    [_].[FiscalQuarter],
    [_].[FiscalYear],
    [_].[FiscalSemester]
from [dbo].[DimDate] as [_]
where [_].[EnglishDayNameOfWeek] = 'Friday')
)
 AS [t0]
GROUP BY [t0].[CalendarYear] 
[/sourcecode]

What’s happening here is that the output of “Get Data” (we so need a better name for this feature – how about “the functionality formerly known as Power Query”?) becomes the inner SELECT statement with the filter on EnglishDayNameOfWeek; while the table in the report that returns the count of dates by Year is responsible for generating the outer SELECT statement with the GROUP BY (this is the part of the Power BI engine that is related to SSAS DirectQuery).

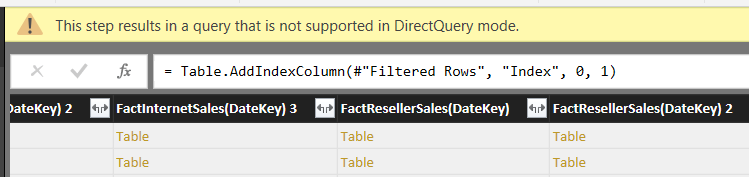
Now, you can only do this if all the steps in “Get Data” can be folded back to SQL. How do you know if they can or not? Well, if query folding can’t take place then you’ll get an error: this is what is meant by the warning about your query being “overly complex” in the documentation. Unfortunately there’s no way of knowing in advance what can be folded and what can’t; with every release of Power BI Desktop and Power Query I’ve noticed that more and more things can be folded (and I’m always pleasantly surprised at the transformations that can be folded, such as pivots and basic calculated columns), but there are still plenty of limitations. For example at the time of writing adding an index column to your query will prevent query folding and therefore break DirectQuery. If you do this, you’ll see the following error in the Query Editor window:

This step results in a query that is not supported in DirectQuery mode

image

Even with this restriction I think the ability to apply transformations in Get Data is very useful indeed, because it means you have a lot of scope for cleaning and filtering data in DirectQuery mode and therefore building ‘live’ reporting solutions on data that isn’t modelled the way you’d like it to be.

While I’m talking about DirectQuery mode, there are a few other points I’d like to mention:

  • Remember, it’s still in Preview and so it has some limitations and bugs. For example, I’ve hit an issue where DirectQuery fails with a connection from my “Recent Sources” list, but works ok if I create a new connection.
  • Prepare to be underwhelmed by the performance of DirectQuery, people: remember this is just ROLAP by another name, ROLAP has been around for years, and ROLAP has always had performance problems. These problems are not just related to the speed of the underlying engine or the size of the data – the ability of the OLAP engine to generate the SQL to get the data it needs also plays a major role. SSAS Multidimensional ROLAP and SSAS Tabular 2012-4 DirectQuery generate some pretty wretched SQL even in the most simple scenarios and it looks like Power BI DirectQuery is a big improvement on them. But what about more complex queries? This is a very difficult problem to crack. My feeling is that if your data does fit into Power BI’s native engine then you should import it rather than use DirectQuery, if you want to get the best possible query performance.
  • I suspect that this performance issue is also the reason why the New Measure button is greyed out in Power BI Desktop when you’re in DirectQuery mode. This isn’t a limitation of the engine because SSAS Tabular does support more complex DAX measures in DirectQuery mode, albeit with some restrictions on the functions you can use. However, the more complex your DAX measures are, the more complex the problem of generating SQL becomes and the more likely your queries are to be slow. I don’t think this is a good reason for completely preventing users from creating their own measures though: there are lots of scenarios where you will need to create measures and performance would still be acceptable. Maybe this is an example of an ‘advanced’ feature that could be switched on by power users?