The problem is caused by something to do with how some web services handle “deflate” compression; apparently the same issue exists in the equivalent native .NET functionality. There are two ways to avoid it though.
First of all, the easy way: ask the web service to use “gzip” compression instead. You can do this by setting the “Accept-Encoding” header to “gzip” like so:
This is more complicated because the Web.BrowserContents function returns the HTML for a web page as viewed by a web browser. Apart from issues like handling authentication you’ll need to parse the result to get the data you need:
It’s doable using the Html.Table function though. Here’s an example of how to handle the response for this particular web service call:
let
  Source = Web.BrowserContents(
    "https://api.open-meteo.com/v1/forecast?latitude=52.52&longitude=13.41&hourly=temperature_2m"
  ),
  HTMLTable = Html.Table(
    Source,
    {{"JSONPayload", "pre"}}
  ),
  JSON = Json.Document(
    HTMLTable{0}[JSONPayload]
  )
in
  JSON
[Thanks to Thais Marshall for bringing me this problem, and to Curt Hagenlocher for explaining and it showing me the first workaround]
Dynamic M parameters are incredibly useful in Power BI when using DirectQuery mode because they allow you to pass values from your report direct to your data source query, bypassing Power BI’s own SQL (or whatever query language your source uses) generation layer. However it isn’t obvious how to pass any value you want: dynamic M parameters must be bound to slicers or filters, and they must be bound to tables in your dataset, which means that at first glance it seems like you can only pass values that are already present somewhere in your dataset (for example in a dimension table) to a dynamic M parameter. This isn’t true though: there is a way to allow passing of any value your users enter to a dynamic M parameter and in this post I’ll show you how.
First of all, why is this useful? There are two reasons why you might want to allow passing of any value to a dynamic M parameter rather than binding to a slicer or filter in the normal way:
Displaying the list of possible values in a slicer or filter can be expensive, especially if the column you’re slicing on contains thousands or millions of values. It can slow down your report and lead to extra queries being run on your DirectQuery source, which can lead to performance problems.
Sometimes the values you want to pass in don’t exist in your DirectQuery source. The scenarios where this is useful are very similar to the scenarios where you’d want to use what-if parameters, but the big limitation of what-if parameters is that you have to pre-calculate all the values that a user might ever want to select and store them in a table. What happens if you don’t want to, or can’t, pre-calculate all the input values?
Let’s see an example of how you can pass any value you want to a dynamic M parameter.
The AdventureWorksDW2017 sample SQL Server database has a table called FactInternetSales with a column called SalesOrderNumber, and let’s say you want to build a Power BI report where an end user can enter whatever SalesOrderNumbers they want and filter the table by them. Let’s also assume that we have to use dynamic M parameters to do this efficiently (which isn’t the case with AdventureWorksDW2017 but could well be in the real world). Here’s what the data looks like:
To set things up in the Power Query Editor you need an M parameter to hold the values entered by the end user. In this example the parameter is called SalesOrderNumber:
Note that the Current Value property is set to a value that is not a valid sales order number, so when no input has been received from the users then no rows will be returned by the report.
Next you need a query that filters the FactInternetSales table by this parameter. Here’s the M code:
let
  Source = Sql.Database(
    "localhost",
    "AdventureWorksDW2017"
  ),
  dbo_FactInternetSales = Source
    {
      [
        Schema = "dbo",
        Item   = "FactInternetSales"
      ]
    }
    [Data],
  #"Removed Other Columns"
    = Table.SelectColumns(
    dbo_FactInternetSales,
    {
      "OrderDateKey",
      "SalesOrderNumber",
      "SalesOrderLineNumber",
      "SalesAmount"
    }
  ),
  FilterList =
    if Type.Is(
      Value.Type(SalesOrderNumber),
      List.Type
    )
    then
      SalesOrderNumber
    else
      {SalesOrderNumber},
  #"Filtered Rows" = Table.SelectRows(
    #"Removed Other Columns",
    each List.Contains(
      FilterList,
      [SalesOrderNumber]
    )
  )
in
  #"Filtered Rows"
There are two interesting things to notice here:
This code handles the cases where a user enters a single value, in which case the SalesOrderNumber M parameter will be of type text, or when the user enters multiple values in which case the SalesOrderNumber M parameter will be of type list. For more details on handling multi-select in dynamic M parameters see this post.
The actual filtering is done using the List.Contains M function, which does fold on SQL Server-related data sources. If you’re using other sources you should check if query folding happens for List.Contains for your source.
Thirdly, you need a dummy dimension table with a single column for the dynamic M parameter to be bound to in the report. The dimension table shouldn’t contain any data; here’s the M code to use (the query is called DimSalesOrderNumber):
let
  Source = #table(
    type table [SalesOrderNumber = text],
    {}
  )
in
  Source
This query returns a table with a single text column called SalesOrderNumber and no rows:
Once you’ve left the Power Query Editor the next thing to do is to bind the SalesOrderNumber M parameter to the SalesOrderNumber column of the DimSalesOrderNumber table:
Note that the Multi-select property has been enabled. Binding the dynamic M parameter to a table with no rows in means there’s no way a regular slicer could be used with it, because there are no values in the table for the slicer to display.
The last problem to solve is the important one: how do you allow end users to enter any value they want? There are two ways I know of. One is to use the filter pane and the “is” filter type under “Advanced filter”:
The filter pane is great because it’s built-in but it only allows the user to enter one or two (if they use the “Or” option) values to filter on. Remember also that not all filter types are available when you’re using dynamic M parameters.
A better approach, if you’re ok with using custom visuals, is to use the Filter By List custom visual which allows the end user to enter – or even copy/paste in – a list of values:
SQLBits is happening again this March at the Celtic Manor resort in Wales. It’s the largest in-person Microsoft data technology conference in Europe and probably now the world; it’s also a lot of fun and something I would never miss. I imagine that a lot of you reading this post feel the same way that I do about SQLBits, but it occurred to me that if you’re relatively new in the world of Power BI you might not have heard of it and might not know why it’s such a great event to attend. Here are ten reasons why you, as a Power BI person, should go:
Don’t be put off by the fact it has “SQL” in the name, this conference has lots of Power BI content. Take a look at the list of training days and conference sessions, and check out the (free!) recordings of sessions from previous events here.
You could spend the whole event just going to Power BI sessions but there are also tons of sessions on related technologies like SQL Server, Synapse and Azure Databricks; there are also sessions on non-technical topics such as public speaking and how to make it as an independent consultant.
Pretty much everyone who is everyone in the world of Power BI will be there. Want to see Alberto Ferrari, or Adam and Patrick from Guy in a Cube, in the flesh? Then come!
It’s ridiculously cheap because it’s a community-run event and no-one is making a profit. In fact even if you live in the USA it may be cheaper to get a flight to the UK and come than attend a similar conference nearer home. People come from all over Europe (especially Scandinavia) to attend.
No training budget? It’s 100% free to attend on Saturday 18th March – all you have to do is register and you get a full day of conference sessions without paying a penny.
Can’t travel? Even if you can’t make it in person there’s a virtual option so you can watch sessions online. You really have to be there in person to get the full experience though.
Apart from the learning opportunities, it’s a great place to network. I know lots of people who have found new jobs and advanced their careers from connections made at SQLBits – me included.
Are you the only Power BI person at your organisation? Feeling lonely? Not sure that you’re doing things properly? You’ll meet people who do the same job as you so you can compare notes and complain about your users.
It’s also a great place to meet companies that work in the Power BI space like Tabular Editor and Power BI Sentinel and check out their products and services.
Most of all you’ll enjoy yourself. I know that might be hard to believe, especially if you’ve been to other tech conferences, but SQLBits is different: there’s entertainment every night, the Friday party is legendary and the infamous Power BI Power Hour is the most fun you’ll ever have with your favourite BI tool. It’s also a very friendly, welcoming and inclusive event.
Hopefully this as convinced you! If you’d like to find out more about SQLBits and how it’s run, I can recommend this recent interview with Simon Sabin on my colleague Kasper de Jonge’s YouTube channel.
When working in the Power Query Editor in Power BI or Excel, especially when you’re editing M code, you may run into the following error:
Expression.Error: A cyclic reference was encountered during evaluation.
What does this message mean and what causes this error? In this blog post I’ll explain.
The first step to understanding what’s going on here is to understand how Power Query evaluates the steps in a query. I wrote a blog post on let expressions in M some time ago, which you can read here, and which goes into a lot of detail on this subject but the basics are quite easy to understand. Conside the following M query:
let
    Step1 = 1,
    Step2 = Step1 + 5,
    Step3 = Step2*2
in
    Step3
If you paste this into a new blank query in the Power Query Editor you’ll see it results in three steps in the Applied Steps on the right hand side of the screen:
The query itself, as you would expect, returns the value 12:
The important thing is to know that Power Query does not evaluate the steps in the order that they appear here – so it does not evaluate Step1 first, then Step2 and then Step3. What it does is evaluate Step3 first, which is needed for the output of the query, and then because it needs the value of Step2 to do this it evaluates Step2 next, and then because it needs the value of Step1 to evaluate Step2 it evaluates Step1 last. You can visualise the chain of dependencies between these steps like so:
Now consider the following M query:
let
    Step1 = Step3,
    Step2 = Step1 + 5,
    Step3 = Step2*2
in
    Step3
The change is that Step1 is now set to the value of Step3 instead of the value 1. This query gives you the “A cyclic reference was encountered during evaluation” error and you can probably see why: the query returns the value of Step3, which needs the value of Step2, which needs the value of Step1, which needs the value of Step3 – so there’s no way of calculating the output of the query. There’s a loop in the dependencies between the steps:
This is the cyclic reference (sometimes known as a “circular reference”) from the error message. As you can imagine it’s very easy to create cyclic references when you’re editing M code manually and changing step names.
It’s also possible to run into this error when using referenced queries, that’s to say when one Power Query query uses the output of another Power Query query as its data source. For example, let’s say you had a query called Query1 with the following M code:
let
    Source = Query2
in
    Source
…and a query called Query2 with the following M code:
let
    Source = Query1
in
    Source
Once again there is a cyclic reference: Query1 refers to the output of Query2 and Query2 refers to the output of Query1. The error message returned for Query2 is:
An error occurred in the ‘Query1’ query. Expression.Error: A cyclic reference was encountered during evaluation.
An extra problem in this case is that if you try to delete just one of these queries, you’ll get the following error message:
The query “Query1” cannot be deleted because it’s being referenced by another query: “Query2”.
You have to select both queries and then delete them, or of course edit one of the queries to break the cyclic reference.
One last thing to mention: recursion is possible in M, meaning that you can write a custom function that calls itself (Miguel Escobar has a detailed post on this here) but it can be very hard to get it working and it’s not always the most efficient way to solve a problem.
In my last post I showed how, in many cases, you can avoid the “dynamic data sources” error with OData data sources by taking advantage of query folding. That’s not always possible though and in this post I’ll show you how you can use the Query option of the OData.Feed function to do so instead.
At first glance the Query option of OData.Feed looks very much like the Query option on Web.Contents which, of course, can also be used to avoid the dynamic data sources error (see here and here) and that’s true up to a point: you can use it to add query parameters to your OData URL. However the documentation is not particularly detailed and there is one thing that will confuse you when you try to use it: you can’t use it with OData system query options like $filter. For example, let’s say you wanted to query the People entity in the TripPin sample OData endpoint to get only the people whose first name was Scott. You can do this as follows:
let
  Source = OData.Feed(
    "https://services.odata.org/TripPinRESTierService/People?$filter=FirstName eq 'Scott'",
    null,
    [Implementation = "2.0"]
  )
in
  Source
Since $filter is a url query parameter, you might then try the following code:
Expression.Error: OData.Feed custom query options cannot start with ‘$’.
This is Power Query’s way of telling you you can’t use OData system query options with the OData.Feed Query option, since they always start with a $ sign. This is a deliberate design decision on the part of the Power Query team; I won’t go into the reasons why it is this way, it’s complicated!
When you first publish a dataset with this query in to the Power BI Service you’ll see an internal server error message coming from the TripPin OData service. You can make the dataset refresh successfully and avoid this and the dynamic data sources error though: you need to check the Skip Test Connection box in the credentials dialog you can open from the Settings pane and set the data privacy level on the data source that is sending data to the OData function appropriately too:
I’ve blogged about the “dynamic data sources” error and the Web.Contents function several times (most recently here), main post here, but never about the fact that you can encounter the same error when working with OData data sources and the OData.Feed function. More importantly, while it seems like the solution to the problem is the same for both functions this is not the case! In fact, the solution may be simpler than you might think.
Let’s take a simple example. Say you have a table with three first names in and you want to use those names to filter the People enity in the TripPin OData sample service. Knowing a bit about how OData works, you might come up with some M code like this:
This code uses the $filter system query option to filter the People entity by the three names provided; it’s not the most efficient code but it works fine in Power BI Desktop. Here’s the output:
However if you publish this to the Power BI Service you’ll get the following error in the dataset Settings page:
You can’t schedule refresh for this dataset because the following data sources currently don’t support refresh
Looking at the docs you’ll see that the OData.Feed function has a Query option like the Web.Contents function and assume that the same solution that works for Web.Contents will work for OData.Feed and it can… but it’s not straightforward and I’ll need to write another post to explain why. (Update: that post is here)
Instead, all you need to do is a simple Merge operation between the first names table and the People table to get the desired result:
One key differences between OData sources and other web services is that query folding is possible on OData sources. Sure enough, if you use Query Diagnostics to see the calls made to the OData API, you’ll see the following call is made:
https://services.odata.org/TripPinRESTierService/(S(gprer1xbnmwlxoeb50woookg))/People?$filter=FirstName eq 'Scott' or FirstName eq 'Angel' or FirstName eq 'Ursula'&$select=UserName%2CFirstName%2CLastName
The Power Query engine has folded the Merge and generated an efficient request using the $filter and $select system query options without you needing to build one yourself.
The dataset will now refresh successfully after you have published it to the Power BI Service. There’s one last important point to mention: you’ll need to make sure the data privacy settings, set in the Power BI Service, for your data sources allow query folding to take place. To learn more about this topic you can watch the video here but TLDR if you’re OK with sending data from one data source to another then you can set all data sources to the “Public” privacy level you should be ok.
The new DAX window functions (announced here, more details on Jeffrey Wang’s blog here and here) have generated a lot of excitement already – they are extremely powerful. However one important benefit of using them has not been mentioned so far: they can give you much better performance in DirectQuery mode because they make it more likely that aggregations are used. After all, the fastest DirectQuery datasets are the ones that can use aggregations (ideally Import mode aggregations) as much as possible.
To illustrate this, here’s a very simple dataset with a fact table in DirectQuery mode and a Date dimension table in Dual mode built on the SQL Server AdventureWorksDW2017 sample database:
Let’s start off with a simple measure that sums up the values in the SalesAmount column:
Sales Amount = SUM('Internet Sales'[SalesAmount])
When you use it in a table visual with the CalendarYear column from the Date table like so:
…Power BI can get the data it needs with a single SQL query. I won’t show the whole query here, but it’s a simple Group By and returns exactly what you’d expect if you run it in SQL Server Management Studio:
Now let’s say you want to do a year-on-year growth calculation. To do this, you’ll need to be able to find the Sales Amount for the previous year. One way to do this in DAX would be to use the SamePeriodsLastYear function like so:
However the SQL query generated for this visual is now a lot more, ahem, verbose and because the DAX time intelligence functions are all resolved at the date granularity it now returns Sales Amount summed up by date rather than by year:
If you write the same previous year sales measure using the new Offset function like so:
…but now the SQL query is much simpler and returns data at the year granularity, as you’d want:
I’m not a SQL expert so I won’t comment on the SQL generated – besides, it may change in the future – but the most important implication of this is that the version of the measure that uses Offset is more likely to be able to use aggregations.
For example, if you add an extra import-mode table to the dataset with the data from the fact table aggregated to year granularity:
…and set it up as an aggregation table:
…then any queries at the year granularity should use it. As you would expect, the query for visual shown above with the measure using SamePeriodLastYear misses the aggregation and goes to the DirectQuery fact table:
The query for the measure using Offset, though, can use the aggregation and there is no DirectQuery activity at all:
This is just one example. I’m almost certain there are other ways to write this calculation without using Offset which will also hit the aggregation but they won’t be as elegant as the Offset version. What’s more, as your measures get more and more complex it gets harder and harder to write DAX that results in simple, efficient SQL in DirectQuery mode and the new window functions are a massive help here.
Every year, on the anniversary of the first-ever post on this blog, I write a post reflecting on what has happened to me professionally in the past year or discussing a non-technical (but still work-related) subject. Two years ago I wrote a post about people who ask the question “Why don’t you add this one simple feature to Power BI?”, something which seems even more relevant now than when I first wrote it. This year I want to discuss a similar topic: people who ask “Wouldn’t it be great if Power BI did this?”, where “this” is some amazing, complicated new piece of functionality they have thought of.
First of all, let me explain why “Wouldn’t it be great if Power BI did this?” is different from “Why don’t you add this one simple feature to Power BI?”. The “one simple feature” question is asked by people who come across the same problem in their day-to-day work so frequently that they can’t understand why Microsoft hasn’t addressed it yet – which is why they are often so frustrated and angry – and where the solution seems obvious and easy. Expanding/collapsing column headers, the top-voted idea on ideas.powerbi.com, is a great example of this type of question: lots of people want it, there are no arguments about how useful it would be, but as Amanda’s comment on the item says it’s actually a lot harder for us to implement than you would think. Hopefully we’ll be able to do it soon.
The “wouldn’t it be great” question is different because it is is prompted by long years of experience of BI tools and projects and is the result of some very creative thinking: the solutions suggested are never obvious, never going to appear on ideas.powerbi.com, and are much more strategic. In the past I’ve been very much the type of person to ask the “wouldn’t it be great” question. For example, about fifteen years ago I remember writing a long email to the Analysis Services team asking for something vaguely like DirectQuery on datasets; more recently I remember trying to convince Chris Finlan that it would be good if paginated reports could render to adaptive cards. Luckily for me the people I sent these emails to were always very polite, even if nothing ever came of my galaxy-brain proposals.
Why does someone like me love asking the “wouldn’t it be great” question so much? It’s the IT equivalent of fantasy football: if you spend way too much time thinking about your favourite football team/BI tool then it’s only natural to imagine how cool it would be to be the coach/program manager of that team/tool and make important decisions about its destiny. Maybe you think you could do a better job than the people who are actually in charge. It’s harmless fun and a great way to while away a few hours with friends over a beer at a conference.
It’s important to understand why the “wouldn’t it be great” question is not a good way of requesting changes to Power BI though. My colleagues Kasper de Jonge and Matthew Roche, both of whom have many years of experience as program managers, helped me with this when I first joined the Power BI CAT team. Now, when I think of a “wouldn’t it be great” idea, I hear Kasper’s voice in my head telling me that it’s the CAT team’s job to collect and curate feedback and it’s the program managers alone whose job it is to design the product. From Matthew I learned the word “solutionize”, which according to the definition I found here means “to come up with a solution for a problem that hasn’t been defined (and might not even exist)” where “common examples are things like developing a feature because you can, iterating and building without research, or selecting a platform or pattern before knowing the required functionality”. Asking the “wouldn’t it be great” question is suggesting a solution when actually the people who design the solutions need to hear the details of the problem you’re trying to solve. If you provide enough details of the problem then it’s possible that the program manager will come to the same conclusion as you about the solution, but even then there are so many other factors to take into account (such as whether it’s even possible to implement your solution) that nothing can be guaranteed.
So, in summary, if you have a problem that you think Power BI needs to solve then you should spend as much time as possible defining that problem rather than imagining what the solution could be – that’s the best way to ensure it gets the attention it deserves from Microsoft. To be clear I’m not saying that you shouldn’t suggest a solution too, I’m just saying that solutions are not what you should be focusing on.
A few weeks ago my colleague Dany Hoter wrote a post on the Azure Data Explorer blog about how using columns on fact tables as dimensions in DirectQuery mode can lead to errors in Power BI. You can read it here:
In the post he mentioned that he could reproduce the same behaviour in SQL Server, so I thought it would be good to show an example of this to raise awareness of the issue because I think it’s one that anyone using DirectQuery mode on any data source is likely to run into.
Consider a simple DirectQuery dataset built from the ContosoRetailDW SQL Server sample database:
There are two important things to point out here:
The FactOnlineSales table has over 12 million rows
The SalesOrderNumber column on the FactOnlineSales table is an example of a degenerate dimension, a dimension key in the fact table that does not have a related dimension table. This typically happens when it would make no sense to create a separate dimension table because it would be the same, or almost the same, granularity as the fact table.
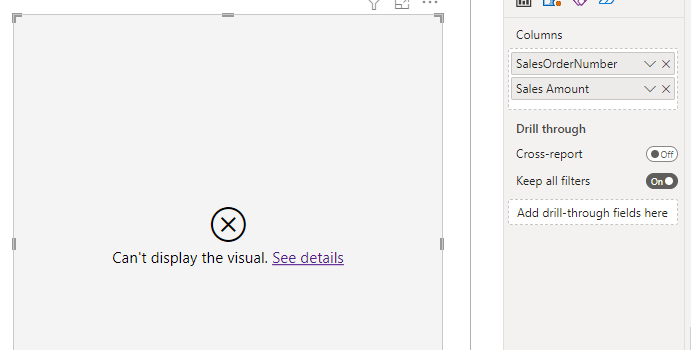
Now if you try to build a simple table visual in a report connected to this dataset that has the SalesOrderNumber column and a measure that sums up the value of the SalesAmount column (ie with a definition of SUM(FactOnlineSales[SalesAmount] ) ) you’ll get the following error:
The resultset of a query to external data source has exceeded the maximum allowed size of ‘1000000’ rows.
This isn’t really surprising: you’ll get this error in DirectQuery mode any time Power BI generates a query against a data source that returns more than one million rows. You can increase this threshold using the Max Intermediate Row Set Count property on a Premium capacity but to be honest, if Power BI is trying to get this much data, you could still run into other performance or memory problems so the best thing to do is to redesign your report to avoid this problem. In this particular example you should question why you need a report with a table that has more than one million rows in it (I suspect the answer from the business will be “to export it to Excel”, which is another argument…).
In many cases you can avoid the error by applying a filter to the visual. In my example filtering the visual to display just the data for January 1st 2007, by applying the filter on the Datekey column of the DimDate table, means you don’t get an error because no SQL query will be generated that returns more than one million rows:
However, the bad news is that if you use slightly more complex DAX in your measure you are still likely run into the same error. For example, if you create a new measure with the following definition:
Error Demo =
var s = [Sales Amount]
return if(s>0, s)
[Yes, I know the measure definition doesn’t make much sense but it’s just a way of reproducing the problem]
….you’ll get the error even with the filter applied:
Why is this? Looking at the various SQL queries generated by Power BI for this visual it’s easy to find the cause of the error:
SELECT
TOP (1000001) [t1].[SalesOrderNumber]
FROM
(
(
select [$Table].[OnlineSalesKey] as [OnlineSalesKey],
    [$Table].[DateKey] as [DateKey],
    [$Table].[StoreKey] as [StoreKey],
    [$Table].[ProductKey] as [ProductKey],
    [$Table].[PromotionKey] as [PromotionKey],
    [$Table].[CurrencyKey] as [CurrencyKey],
    [$Table].[CustomerKey] as [CustomerKey],
    [$Table].[SalesOrderNumber] as [SalesOrderNumber],
    [$Table].[SalesOrderLineNumber] as [SalesOrderLineNumber],
    [$Table].[SalesQuantity] as [SalesQuantity],
    [$Table].[SalesAmount] as [SalesAmount],
    [$Table].[ReturnQuantity] as [ReturnQuantity],
    [$Table].[ReturnAmount] as [ReturnAmount],
    [$Table].[DiscountQuantity] as [DiscountQuantity],
    [$Table].[DiscountAmount] as [DiscountAmount],
    [$Table].[TotalCost] as [TotalCost],
    [$Table].[UnitCost] as [UnitCost],
    [$Table].[UnitPrice] as [UnitPrice],
    [$Table].[ETLLoadID] as [ETLLoadID],
    [$Table].[LoadDate] as [LoadDate],
    [$Table].[UpdateDate] as [UpdateDate]
from [dbo].[FactOnlineSales] as [$Table]
)
)
 AS [t1]
GROUP BY [t1].[SalesOrderNumber]
Why is this query generated? Why is there no WHERE clause applying the date filter? When a DAX query is run Power BI does the following:
Send dimension queries per unique dimension table. Only filters directly placed on the dimension table apply in this case.
Send measure queries for each measure. All filters may apply in this case.
Join the results from 1 and 2.
Sometimes, as in the example where just the SUM measure is used, it can optimise the dimension queries and apply the filter from the dimension table too. Sometimes, as in the last example above, it can’t and it runs a dimension query asking for all the distinct values from SalesOrderNumber in the fact table. You can try to work around it by rewriting your DAX, by filtering on the fact table and not the dimension table – applying a filter on the Datekey column of FactOnlineSales for 1/1/2007, rather than on the Datekey column of DimDate, results in no error – or using a dynamic M parameter to get more control over the queries generated. However the best course of action is to avoid using any column from a large fact table as a dimension, whether it’s a legitimate degenerate dimension or a column that should really be modelled in a separate dimension table.
[Thanks to Dany Hoter and Jeffrey Wang for the information in this post]
Last week I presented at the Nashville Modern Excel user group and before my session started Will Harvey, the organiser, did a quick run-through of what’s new in the Power Platform. He highlighted a service that piqued my interest called QuickChart which has a new Power Automate connector. QuickChart have an API that you can pass your data to and which will return an image of that data in a chart; they also have a free tier so you can play with it easily. It’s pretty cool (although this isn’t a formal endorsement) – try opening the following URL in your browser:
It made me think – can you use this with the new Excel Image function? And indeed you can. For example, here’s the URL above used from the Image function:
What could this be used for? Excel has had sparklines, mini charts that fit inside a cell, for a while but they’re not dynamic: the number of sparklines on a worksheet is fixed. I realised that by using QuickChart with dynamic array functions you can create dynamic arrays that return sparklines, giving you sparkline small multiples. Helpfully QuickChart explicitly support sparklines, for example:
By the way, this is exactly the kind of formula that the Advanced Formula Environment makes much easier to write; Mynda Treacy has a great video on it here.
This is what the function does:
It takes two parameters, product and country
The function definition is broken down into steps using the Let function
The filterrows step filters the Sales table using the Filter function to get just the rows for the specified product and country
The choosesales step uses the ChooseCols function to get the column that contains the sales values
The concat step uses the TextJoin function to turn these sales values into a comma delimited list of values
Finally, this list of values is injected into a call to the QuickChart API using the Image function
The whole thing is wrapped in IfError to prevent any error values appearing, for example if a product or country value was passed to the function that didn’t appear in the Sales table
This function can now be called from a formula like so:
=GetGraph("Apples", "UK")
But we want something more dynamic. Consider the following:
Cell B3 contains a dynamic array formula using the Unique function to return all the distinct country names in the Sales table:
=UNIQUE(Sales[Country])
Cell C2 contains a similar formula but gets the distinct product names and uses the ToRow function to return these names in different rows:
=TOROW(UNIQUE(Sales[Product], FALSE))
Finally cell C3 uses the MakeArray function to call the GetGraph for each combination of country and product:
The good thing about this is that if new products or countries are added to the Sales table, like so:
…new columns and rows automatically appear to display them:
You’d probably need to get a paid subscription to QuickChart if you wanted to do this in the real world, but for me the point of all this is how much more the amazing new functionality added to Excel in the past few years (dynamic arrays, Image, Let, Lambda, the Advanced Formula Environment etc) allows you to do. Excel is almost as exciting as Power BI these days!