A few months ago a new option was added to the Sql.Database and Sql.Databases functions in Power Query in Power BI and Excel which allows Power Query queries that combine data from different SQL Server databases to fold. Here’s a simple example showing how to use it.
On my local PC I have SQL Server installed and the Adventure Works DW 2017 and Contoso Retail DW sample databases:

Both of these databases have date dimension tables called DimDate. Let’s say you want to create a Power Query query that merges these two tables.
Here’s the M code for a Power Query query called DimDate AW to get just the DateKey and CalendarYear columns from the DimDate table of the Adventure Works DW 2017 database:
let
    Source = Sql.Database("localhost", "AdventureWorksDW2017"),
    dbo_DimDate = Source{[Schema="dbo",Item="DimDate"]}[Data],
    #"Removed Other Columns" = Table.SelectColumns(dbo_DimDate,{"DateKey", "CalendarYear"})
in
    #"Removed Other Columns"
Here’s the M code for a Power Query query called DimDate Contoso to get just the Datekey and CalendarYear columns from the DimDate table in the ContosoRetailDW database:
let
    Source = Sql.Database("localhost", "ContosoRetailDW"),
    dbo_DimDate = Source{[Schema="dbo",Item="DimDate"]}[Data],
    #"Removed Other Columns" = Table.SelectColumns(dbo_DimDate,{"Datekey", "CalendarYear"})
in
    #"Removed Other Columns"
Both of these Power Query queries fold. However if you create a third query to merge these two queries (ie do the equivalent of a SQL join between them) on the CalendarYear columns like so:
let
Source = Table.NestedJoin(
#"DimDate Contoso",
{"CalendarYear"},
#"DimDate AW",
{"CalendarYear"},
"DimDate AW",
JoinKind.LeftOuter
),
#"Expanded DimDate AW" = Table.ExpandTableColumn(
Source,
"DimDate AW",
{"DateKey", "CalendarYear"},
{"DimDate AW.DateKey", "DimDate AW.CalendarYear"}
)
in
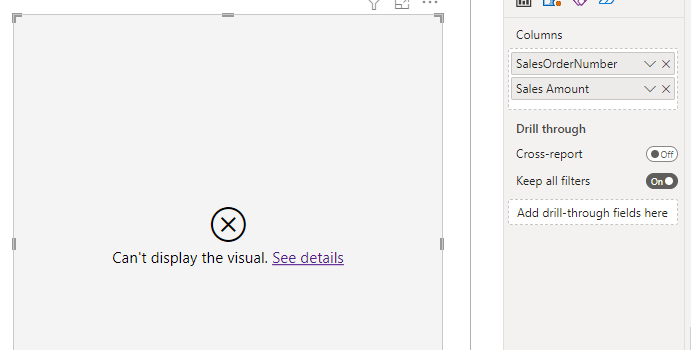
#"Expanded DimDate AW"…this query does not fold, because it combines data from two different SQL Server databases.
However if you edit the Sql.Database function in the Source step of both of the first two queries above to set the new EnableCrossDatabaseFolding option to true, like so:
    Source =
    Sql.Database(
        "localhost",
        "ContosoRetailDW",
        [EnableCrossDatabaseFolding=true]
        ),
…then the query that merges these two queries does fold: