Passing Any Arbitrary Value From A Power BI Report To A Dynamic M Parameter

Dynamic M parameters are incredibly useful in Power BI when using DirectQuery mode because they allow you to pass values from your report direct to your data source query, bypassing Power BI’s own SQL (or whatever query language your source uses) generation layer. However it isn’t obvious how to pass any value you want: dynamic M parameters must be bound to slicers or filters, and they must be bound to tables in your dataset, which means that at first glance it seems like you can only pass values that are already present somewhere in your dataset (for example in a dimension table) to a dynamic M parameter. This isn’t true though: there is a way to allow passing of any value your users enter to a dynamic M parameter and in this post I’ll show you how.

First of all, why is this useful? There are two reasons why you might want to allow passing of any value to a dynamic M parameter rather than binding to a slicer or filter in the normal way:

  1. Displaying the list of possible values in a slicer or filter can be expensive, especially if the column you’re slicing on contains thousands or millions of values. It can slow down your report and lead to extra queries being run on your DirectQuery source, which can lead to performance problems.
  2. Sometimes the values you want to pass in don’t exist in your DirectQuery source. The scenarios where this is useful are very similar to the scenarios where you’d want to use what-if parameters, but the big limitation of what-if parameters is that you have to pre-calculate all the values that a user might ever want to select and store them in a table. What happens if you don’t want to, or can’t, pre-calculate all the input values?

Let’s see an example of how you can pass any value you want to a dynamic M parameter.

The AdventureWorksDW2017 sample SQL Server database has a table called FactInternetSales with a column called SalesOrderNumber, and let’s say you want to build a Power BI report where an end user can enter whatever SalesOrderNumbers they want and filter the table by them. Let’s also assume that we have to use dynamic M parameters to do this efficiently (which isn’t the case with AdventureWorksDW2017 but could well be in the real world). Here’s what the data looks like:

To set things up in the Power Query Editor you need an M parameter to hold the values entered by the end user. In this example the parameter is called SalesOrderNumber:

Note that the Current Value property is set to a value that is not a valid sales order number, so when no input has been received from the users then no rows will be returned by the report.

Next you need a query that filters the FactInternetSales table by this parameter. Here’s the M code:

let
  Source = Sql.Database(
    "localhost",
    "AdventureWorksDW2017"
  ),
  dbo_FactInternetSales = Source
    {
      [
        Schema = "dbo",
        Item   = "FactInternetSales"
      ]
    }
    [Data],
  #"Removed Other Columns"
    = Table.SelectColumns(
    dbo_FactInternetSales,
    {
      "OrderDateKey",
      "SalesOrderNumber",
      "SalesOrderLineNumber",
      "SalesAmount"
    }
  ),
  FilterList =
    if Type.Is(
      Value.Type(SalesOrderNumber),
      List.Type
    )
    then
      SalesOrderNumber
    else
      {SalesOrderNumber},
  #"Filtered Rows" = Table.SelectRows(
    #"Removed Other Columns",
    each List.Contains(
      FilterList,
      [SalesOrderNumber]
    )
  )
in
  #"Filtered Rows"

There are two interesting things to notice here:

  • This code handles the cases where a user enters a single value, in which case the SalesOrderNumber M parameter will be of type text, or when the user enters multiple values in which case the SalesOrderNumber M parameter will be of type list. For more details on handling multi-select in dynamic M parameters see this post.
  • The actual filtering is done using the List.Contains M function, which does fold on SQL Server-related data sources. If you’re using other sources you should check if query folding happens for List.Contains for your source.

Thirdly, you need a dummy dimension table with a single column for the dynamic M parameter to be bound to in the report. The dimension table shouldn’t contain any data; here’s the M code to use (the query is called DimSalesOrderNumber):

let
  Source = #table(
    type table [SalesOrderNumber = text],
    {}
  )
in
  Source

This query returns a table with a single text column called SalesOrderNumber and no rows:

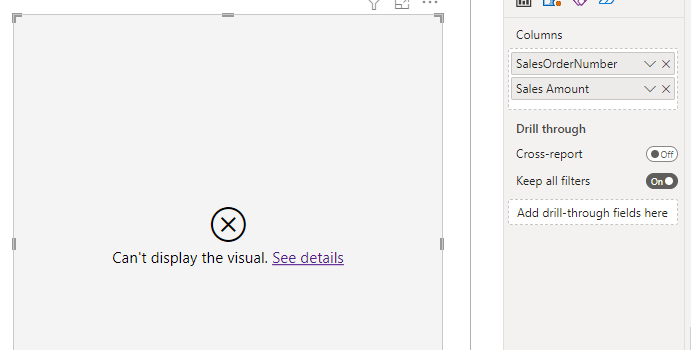
Once you’ve left the Power Query Editor the next thing to do is to bind the SalesOrderNumber M parameter to the SalesOrderNumber column of the DimSalesOrderNumber table:

Note that the Multi-select property has been enabled. Binding the dynamic M parameter to a table with no rows in means there’s no way a regular slicer could be used with it, because there are no values in the table for the slicer to display.

The last problem to solve is the important one: how do you allow end users to enter any value they want? There are two ways I know of. One is to use the filter pane and the “is” filter type under “Advanced filter”:

The filter pane is great because it’s built-in but it only allows the user to enter one or two (if they use the “Or” option) values to filter on. Remember also that not all filter types are available when you’re using dynamic M parameters.

A better approach, if you’re ok with using custom visuals, is to use the Filter By List custom visual which allows the end user to enter – or even copy/paste in – a list of values:

Top 10 Reasons Why Power BI People Should Attend SQLBits

SQLBits is happening again this March at the Celtic Manor resort in Wales. It’s the largest in-person Microsoft data technology conference in Europe and probably now the world; it’s also a lot of fun and something I would never miss. I imagine that a lot of you reading this post feel the same way that I do about SQLBits, but it occurred to me that if you’re relatively new in the world of Power BI you might not have heard of it and might not know why it’s such a great event to attend. Here are ten reasons why you, as a Power BI person, should go:

  1. Don’t be put off by the fact it has “SQL” in the name, this conference has lots of Power BI content. Take a look at the list of training days and conference sessions, and check out the (free!) recordings of sessions from previous events here.
  2. You could spend the whole event just going to Power BI sessions but there are also tons of sessions on related technologies like SQL Server, Synapse and Azure Databricks; there are also sessions on non-technical topics such as public speaking and how to make it as an independent consultant.
  3. Pretty much everyone who is everyone in the world of Power BI will be there. Want to see Alberto Ferrari, or Adam and Patrick from Guy in a Cube, in the flesh? Then come!
  4. It’s ridiculously cheap because it’s a community-run event and no-one is making a profit. In fact even if you live in the USA it may be cheaper to get a flight to the UK and come than attend a similar conference nearer home. People come from all over Europe (especially Scandinavia) to attend.
  5. No training budget? It’s 100% free to attend on Saturday 18th March – all you have to do is register and you get a full day of conference sessions without paying a penny.
  6. Can’t travel? Even if you can’t make it in person there’s a virtual option so you can watch sessions online. You really have to be there in person to get the full experience though.
  7. Apart from the learning opportunities, it’s a great place to network. I know lots of people who have found new jobs and advanced their careers from connections made at SQLBits – me included.
  8. Are you the only Power BI person at your organisation? Feeling lonely? Not sure that you’re doing things properly? You’ll meet people who do the same job as you so you can compare notes and complain about your users.
  9. It’s also a great place to meet companies that work in the Power BI space like Tabular Editor and Power BI Sentinel and check out their products and services.
  10. Most of all you’ll enjoy yourself. I know that might be hard to believe, especially if you’ve been to other tech conferences, but SQLBits is different: there’s entertainment every night, the Friday party is legendary and the infamous Power BI Power Hour is the most fun you’ll ever have with your favourite BI tool. It’s also a very friendly, welcoming and inclusive event.

Hopefully this as convinced you! If you’d like to find out more about SQLBits and how it’s run, I can recommend this recent interview with Simon Sabin on my colleague Kasper de Jonge’s YouTube channel.

Understanding The “A cyclic reference was encountered during evaluation” Error In Power Query In Power BI Or Excel

When working in the Power Query Editor in Power BI or Excel, especially when you’re editing M code, you may run into the following error:

Expression.Error: A cyclic reference was encountered during evaluation.

What does this message mean and what causes this error? In this blog post I’ll explain.

The first step to understanding what’s going on here is to understand how Power Query evaluates the steps in a query. I wrote a blog post on let expressions in M some time ago, which you can read here, and which goes into a lot of detail on this subject but the basics are quite easy to understand. Conside the following M query:

let
    Step1 = 1,
    Step2 = Step1 + 5,
    Step3 = Step2*2
in
    Step3

If you paste this into a new blank query in the Power Query Editor you’ll see it results in three steps in the Applied Steps on the right hand side of the screen:

The query itself, as you would expect, returns the value 12:

The important thing is to know that Power Query does not evaluate the steps in the order that they appear here – so it does not evaluate Step1 first, then Step2 and then Step3. What it does is evaluate Step3 first, which is needed for the output of the query, and then because it needs the value of Step2 to do this it evaluates Step2 next, and then because it needs the value of Step1 to evaluate Step2 it evaluates Step1 last. You can visualise the chain of dependencies between these steps like so:

Now consider the following M query:

let
    Step1 = Step3,
    Step2 = Step1 + 5,
    Step3 = Step2*2
in
    Step3

The change is that Step1 is now set to the value of Step3 instead of the value 1. This query gives you the “A cyclic reference was encountered during evaluation” error and you can probably see why: the query returns the value of Step3, which needs the value of Step2, which needs the value of Step1, which needs the value of Step3 – so there’s no way of calculating the output of the query. There’s a loop in the dependencies between the steps:

This is the cyclic reference (sometimes known as a “circular reference”) from the error message. As you can imagine it’s very easy to create cyclic references when you’re editing M code manually and changing step names.

It’s also possible to run into this error when using referenced queries, that’s to say when one Power Query query uses the output of another Power Query query as its data source. For example, let’s say you had a query called Query1 with the following M code:

let
    Source = Query2
in
    Source

…and a query called Query2 with the following M code:

let
    Source = Query1
in
    Source

Once again there is a cyclic reference: Query1 refers to the output of Query2 and Query2 refers to the output of Query1. The error message returned for Query2 is:

An error occurred in the ‘Query1’ query. Expression.Error: A cyclic reference was encountered during evaluation.

An extra problem in this case is that if you try to delete just one of these queries, you’ll get the following error message:

The query “Query1” cannot be deleted because it’s being referenced by another query: “Query2”.

You have to select both queries and then delete them, or of course edit one of the queries to break the cyclic reference.

One last thing to mention: recursion is possible in M, meaning that you can write a custom function that calls itself (Miguel Escobar has a detailed post on this here) but it can be very hard to get it working and it’s not always the most efficient way to solve a problem.

Using OData.Feed And The Query Option To Avoid The Dynamic Data Sources Error In Power BI

In my last post I showed how, in many cases, you can avoid the “dynamic data sources” error with OData data sources by taking advantage of query folding. That’s not always possible though and in this post I’ll show you how you can use the Query option of the OData.Feed function to do so instead.

At first glance the Query option of OData.Feed looks very much like the Query option on Web.Contents which, of course, can also be used to avoid the dynamic data sources error (see here and here) and that’s true up to a point: you can use it to add query parameters to your OData URL. However the documentation is not particularly detailed and there is one thing that will confuse you when you try to use it: you can’t use it with OData system query options like $filter. For example, let’s say you wanted to query the People entity in the TripPin sample OData endpoint to get only the people whose first name was Scott. You can do this as follows:

let
  Source = OData.Feed(
    "https://services.odata.org/TripPinRESTierService/People?$filter=FirstName eq 'Scott'",
    null,
    [Implementation = "2.0"]
  )
in
  Source

Since $filter is a url query parameter, you might then try the following code:

let
  Source = OData.Feed(
    "https://services.odata.org/TripPinRESTierService/People",
    null,
    [
      Implementation = "2.0",
      Query = [
        #"$filter"
          = "FirstName eq 'Scott'"
      ]
    ]
  )
in
  Source

Unfortunately, this returns the following error:

Expression.Error: OData.Feed custom query options cannot start with ‘$’.

This is Power Query’s way of telling you you can’t use OData system query options with the OData.Feed Query option, since they always start with a $ sign. This is a deliberate design decision on the part of the Power Query team; I won’t go into the reasons why it is this way, it’s complicated!

However, you can use the Query option with OData custom query options like so:

let
  Source = OData.Feed(
    "https://services.odata.org/TripPinRESTierService/People",
    null,
    [
      Implementation = "2.0",
      Query = [#"debug-mode" = "true"]
    ]
  )
in
  Source

More importantly, you can use the Query option with OData parameter aliases. The original URL we were looking at:

https://services.odata.org/TripPinRESTierService/People?$filter=FirstName eq 'Scott'

…can be rewritten to use parameter aliases like so:

https://services.odata.org/TripPinRESTierService/People?$filter=FirstName eq @fn&@fn='Scott'

…and the rewritten version can be called using the Query option like so:

let
  Source = OData.Feed(
    "https://services.odata.org/TripPinRESTierService/People?$filter=FirstName eq @f", 
    null, 
    [
      Implementation = "2.0", 
      Query = [#"@f" = "'Scott'"]
    ]
  )
in
  Source

You can use parameter aliases to call OData unbound functions too. For example, you can call TripPin’s GetNearestAirport function like so:

let
  Source = OData.Feed(
    "https://services.odata.org/TripPinRESTierService/GetNearestAirport(lat = @latitude, lon = @longitude)", 
    null, 
    [
      Implementation = "2.0", 
      Query = [
        #"@latitude"  = "100", 
        #"@longitude" = "0"
      ]
    ]
  ), 
  #"Converted to Table" = Record.ToTable(
    Source
  )
in
  #"Converted to Table"

Finally, here’s an example of a query that starts with a table of latitudes and longitudes and calls the GetNearestAirport function for each row:

let
  Source = #table(
    type table [
      LocationLatitude = text,
      LocationLongitude = text
    ],
    {
      {"10", "10"},
      {"33", "-118"},
      {"100", "-100"}
    }
  ),
  #"Added Custom" = Table.AddColumn(
    Source,
    "FunctionCall",
    each OData.Feed(
      "https://services.odata.org/TripPinRESTierService/GetNearestAirport(lat = @latitude, lon = @longitude)",
      null,
      [
        Implementation = "2.0",
        Query = [
          #"@latitude" = [
            LocationLatitude
          ],
          #"@longitude" = [
            LocationLongitude
          ]
        ]
      ]
    )
  ),
  #"Expanded FunctionCall"
    = Table.ExpandRecordColumn(
    #"Added Custom",
    "FunctionCall",
    {"Name", "IcaoCode", "IataCode"},
    {
      "FunctionCall.Name",
      "FunctionCall.IcaoCode",
      "FunctionCall.IataCode"
    }
  )
in
  #"Expanded FunctionCall"

When you first publish a dataset with this query in to the Power BI Service you’ll see an internal server error message coming from the TripPin OData service. You can make the dataset refresh successfully and avoid this and the dynamic data sources error though: you need to check the Skip Test Connection box in the credentials dialog you can open from the Settings pane and set the data privacy level on the data source that is sending data to the OData function appropriately too:

OData.Feed And The Dynamic Data Sources Error In Power BI

I’ve blogged about the “dynamic data sources” error and the Web.Contents function several times (most recently here), main post here, but never about the fact that you can encounter the same error when working with OData data sources and the OData.Feed function. More importantly, while it seems like the solution to the problem is the same for both functions this is not the case! In fact, the solution may be simpler than you might think.

Let’s take a simple example. Say you have a table with three first names in and you want to use those names to filter the People enity in the TripPin OData sample service. Knowing a bit about how OData works, you might come up with some M code like this:

let
  Source = #table(
    type table [FirstName = text],
    {{"Scott"}, {"Angel"}, {"Ursula"}}
  ),
  #"Added Custom" = Table.AddColumn(
    Source,
    "Person",
    each OData.Feed(
      "https://services.odata.org/TripPinRESTierService/People?$filter=FirstName eq '"
        & [FirstName]
        & "'",
      null,
      [Implementation = "2.0"]
    )
  ),
  #"Expanded Person"
    = Table.ExpandTableColumn(
    #"Added Custom",
    "Person",
    {
      "UserName",
      "FirstName",
      "LastName"
    },
    {
      "Person.UserName",
      "Person.FirstName",
      "Person.LastName"
    }
  )
in
  #"Expanded Person"

This code uses the $filter system query option to filter the People entity by the three names provided; it’s not the most efficient code but it works fine in Power BI Desktop. Here’s the output:

However if you publish this to the Power BI Service you’ll get the following error in the dataset Settings page:

You can’t schedule refresh for this dataset because the following data sources currently don’t support refresh

Looking at the docs you’ll see that the OData.Feed function has a Query option like the Web.Contents function and assume that the same solution that works for Web.Contents will work for OData.Feed and it can… but it’s not straightforward and I’ll need to write another post to explain why. (Update: that post is here)

Instead, all you need to do is a simple Merge operation between the first names table and the People table to get the desired result:

let
  Source = #table(
    type table [FirstName = text],
    {{"Scott"}, {"Angel"}, {"Ursula"}}
  ),
  #"Merged Queries" = Table.NestedJoin(
    Source,
    {"FirstName"},
    People,
    {"FirstName"},
    "People",
    JoinKind.Inner
  ),
  #"Expanded People"
    = Table.ExpandTableColumn(
    #"Merged Queries",
    "People",
    {
      "UserName",
      "FirstName",
      "LastName"
    },
    {
      "People.UserName",
      "People.FirstName",
      "People.LastName"
    }
  )
in
  #"Expanded People"

One key differences between OData sources and other web services is that query folding is possible on OData sources. Sure enough, if you use Query Diagnostics to see the calls made to the OData API, you’ll see the following call is made:

https://services.odata.org/TripPinRESTierService/(S(gprer1xbnmwlxoeb50woookg))/People?$filter=FirstName eq 'Scott' or FirstName eq 'Angel' or FirstName eq 'Ursula'&$select=UserName%2CFirstName%2CLastName

The Power Query engine has folded the Merge and generated an efficient request using the $filter and $select system query options without you needing to build one yourself.

The dataset will now refresh successfully after you have published it to the Power BI Service. There’s one last important point to mention: you’ll need to make sure the data privacy settings, set in the Power BI Service, for your data sources allow query folding to take place. To learn more about this topic you can watch the video here but TLDR if you’re OK with sending data from one data source to another then you can set all data sources to the “Public” privacy level you should be ok.

Why DAX Window Functions Are Important For Performance In Power BI DirectQuery Mode

The new DAX window functions (announced here, more details on Jeffrey Wang’s blog here and here) have generated a lot of excitement already – they are extremely powerful. However one important benefit of using them has not been mentioned so far: they can give you much better performance in DirectQuery mode because they make it more likely that aggregations are used. After all, the fastest DirectQuery datasets are the ones that can use aggregations (ideally Import mode aggregations) as much as possible.

To illustrate this, here’s a very simple dataset with a fact table in DirectQuery mode and a Date dimension table in Dual mode built on the SQL Server AdventureWorksDW2017 sample database:

Let’s start off with a simple measure that sums up the values in the SalesAmount column:

Sales Amount = SUM('Internet Sales'[SalesAmount])

When you use it in a table visual with the CalendarYear column from the Date table like so:

…Power BI can get the data it needs with a single SQL query. I won’t show the whole query here, but it’s a simple Group By and returns exactly what you’d expect if you run it in SQL Server Management Studio:

Now let’s say you want to do a year-on-year growth calculation. To do this, you’ll need to be able to find the Sales Amount for the previous year. One way to do this in DAX would be to use the SamePeriodsLastYear function like so:

LY Sales Amount V1 =
CALCULATE (
    [Sales Amount],
    SAMEPERIODLASTYEAR ( 'Date'[FullDateAlternateKey] )
)

Used in a table it gives the correct result:

However the SQL query generated for this visual is now a lot more, ahem, verbose and because the DAX time intelligence functions are all resolved at the date granularity it now returns Sales Amount summed up by date rather than by year:

If you write the same previous year sales measure using the new Offset function like so:

LY Sales Amount V2 =
CALCULATE (
    [Sales Amount],
    OFFSET (
        -1,
        ALLSELECTED ( 'Date'[CalendarYear] ),
        ORDERBY ( 'Date'[CalendarYear], ASC )
    )
)

…you get the same result as before:

…but now the SQL query is much simpler and returns data at the year granularity, as you’d want:

I’m not a SQL expert so I won’t comment on the SQL generated – besides, it may change in the future – but the most important implication of this is that the version of the measure that uses Offset is more likely to be able to use aggregations.

For example, if you add an extra import-mode table to the dataset with the data from the fact table aggregated to year granularity:

…and set it up as an aggregation table:

…then any queries at the year granularity should use it. As you would expect, the query for visual shown above with the measure using SamePeriodLastYear misses the aggregation and goes to the DirectQuery fact table:

The query for the measure using Offset, though, can use the aggregation and there is no DirectQuery activity at all:

This is just one example. I’m almost certain there are other ways to write this calculation without using Offset which will also hit the aggregation but they won’t be as elegant as the Offset version. What’s more, as your measures get more and more complex it gets harder and harder to write DAX that results in simple, efficient SQL in DirectQuery mode and the new window functions are a massive help here.

Power BI DirectQuery Mode And Degenerate Dimensions

A few weeks ago my colleague Dany Hoter wrote a post on the Azure Data Explorer blog about how using columns on fact tables as dimensions in DirectQuery mode can lead to errors in Power BI. You can read it here:

https://techcommunity.microsoft.com/t5/azure-data-explorer-blog/to-star-or-not-to-star-more-about-data-modeling-in-power-bi/ba-p/3689933

In the post he mentioned that he could reproduce the same behaviour in SQL Server, so I thought it would be good to show an example of this to raise awareness of the issue because I think it’s one that anyone using DirectQuery mode on any data source is likely to run into.

Consider a simple DirectQuery dataset built from the ContosoRetailDW SQL Server sample database:

There are two important things to point out here:

  1. The FactOnlineSales table has over 12 million rows
  2. The SalesOrderNumber column on the FactOnlineSales table is an example of a degenerate dimension, a dimension key in the fact table that does not have a related dimension table. This typically happens when it would make no sense to create a separate dimension table because it would be the same, or almost the same, granularity as the fact table.

Now if you try to build a simple table visual in a report connected to this dataset that has the SalesOrderNumber column and a measure that sums up the value of the SalesAmount column (ie with a definition of SUM(FactOnlineSales[SalesAmount] ) ) you’ll get the following error:

The resultset of a query to external data source has exceeded the maximum allowed size of ‘1000000’ rows.

This isn’t really surprising: you’ll get this error in DirectQuery mode any time Power BI generates a query against a data source that returns more than one million rows. You can increase this threshold using the Max Intermediate Row Set Count property on a Premium capacity but to be honest, if Power BI is trying to get this much data, you could still run into other performance or memory problems so the best thing to do is to redesign your report to avoid this problem. In this particular example you should question why you need a report with a table that has more than one million rows in it (I suspect the answer from the business will be “to export it to Excel”, which is another argument…).

In many cases you can avoid the error by applying a filter to the visual. In my example filtering the visual to display just the data for January 1st 2007, by applying the filter on the Datekey column of the DimDate table, means you don’t get an error because no SQL query will be generated that returns more than one million rows:

However, the bad news is that if you use slightly more complex DAX in your measure you are still likely run into the same error. For example, if you create a new measure with the following definition:

Error Demo = 
var s = [Sales Amount]
return if(s>0, s)

[Yes, I know the measure definition doesn’t make much sense but it’s just a way of reproducing the problem]

….you’ll get the error even with the filter applied:

Why is this? Looking at the various SQL queries generated by Power BI for this visual it’s easy to find the cause of the error:

SELECT 
TOP (1000001) [t1].[SalesOrderNumber]
FROM 
(
(
select [$Table].[OnlineSalesKey] as [OnlineSalesKey],
    [$Table].[DateKey] as [DateKey],
    [$Table].[StoreKey] as [StoreKey],
    [$Table].[ProductKey] as [ProductKey],
    [$Table].[PromotionKey] as [PromotionKey],
    [$Table].[CurrencyKey] as [CurrencyKey],
    [$Table].[CustomerKey] as [CustomerKey],
    [$Table].[SalesOrderNumber] as [SalesOrderNumber],
    [$Table].[SalesOrderLineNumber] as [SalesOrderLineNumber],
    [$Table].[SalesQuantity] as [SalesQuantity],
    [$Table].[SalesAmount] as [SalesAmount],
    [$Table].[ReturnQuantity] as [ReturnQuantity],
    [$Table].[ReturnAmount] as [ReturnAmount],
    [$Table].[DiscountQuantity] as [DiscountQuantity],
    [$Table].[DiscountAmount] as [DiscountAmount],
    [$Table].[TotalCost] as [TotalCost],
    [$Table].[UnitCost] as [UnitCost],
    [$Table].[UnitPrice] as [UnitPrice],
    [$Table].[ETLLoadID] as [ETLLoadID],
    [$Table].[LoadDate] as [LoadDate],
    [$Table].[UpdateDate] as [UpdateDate]
from [dbo].[FactOnlineSales] as [$Table]
)
)
 AS [t1]
GROUP BY [t1].[SalesOrderNumber] 

Why is this query generated? Why is there no WHERE clause applying the date filter? When a DAX query is run Power BI does the following:

  1. Send dimension queries per unique dimension table. Only filters directly placed on the dimension table apply in this case.
  2. Send measure queries for each measure. All filters may apply in this case.
  3. Join the results from 1 and 2.

Sometimes, as in the example where just the SUM measure is used, it can optimise the dimension queries and apply the filter from the dimension table too. Sometimes, as in the last example above, it can’t and it runs a dimension query asking for all the distinct values from SalesOrderNumber in the fact table. You can try to work around it by rewriting your DAX, by filtering on the fact table and not the dimension table – applying a filter on the Datekey column of FactOnlineSales for 1/1/2007, rather than on the Datekey column of DimDate, results in no error – or using a dynamic M parameter to get more control over the queries generated. However the best course of action is to avoid using any column from a large fact table as a dimension, whether it’s a legitimate degenerate dimension or a column that should really be modelled in a separate dimension table.

[Thanks to Dany Hoter and Jeffrey Wang for the information in this post]

UPDATE February 2023: in some cases you may be able to avoid this error by building an aggregation table https://blog.crossjoin.co.uk/2023/02/08/avoiding-the-maximum-allowed-size-error-in-power-bi-directquery-mode-with-aggregations-on-degenerate-dimensions/

Is Power BI A Semantic Layer?

The short answer: yes. And it’s a metrics layer and a metrics store and it’s headless BI too for what it’s worth.

I’ve been meaning to blog about this question for a long time now, for two reasons:

  1. Customers migrating to Power BI often ask me if Microsoft also has a product or service that can act as a semantic layer, so I need to explain that Power BI is already a semantic layer.
  2. I read the deliberations of the cool kids of analytics (Benn Stancil for example, who I enjoy a lot) and get the feeling that Microsoft and Power BI inhabit a separate universe that is invisible to them. This exchange on Twitter is a prime example.

The reason I haven’t blogged about this question yet is that earlier this year Aurimas Račas wrote a truly outstanding blog post on this subject, which I strongly recommend you read:

https://aurimas.eu/blog/2022/08/metrics-layers-and-power-bi/

What more could I say? Well Aurimas’s blog post has the virtue of being impartial and I thought it would be useful adding a few thoughts from the perspective of a Microsoft insider. These opinions are my own, not official Microsoft opinions, but I don’t think any of my colleagues would disagree with them.

So is Power BI a semantic layer?

Back to the main question. Whether or not we do a good job of promoting Power BI as a semantic layer to customers we certainly think of it as one internally; I see it referred to as one internally all the time. Indeed we always thought of Power BI’s ancestors Azure Analysis Services and SQL Server Analysis Services, all through their 20+ year history, as semantic layers too – who remembers the terms BI Semantic Model or UDM?. One of the points Aurimas makes is that this is an awareness problem more than anything else: because Power BI can be used as a self-service BI tool as well as an enterprise BI tool and because more people use it as a self-service tool, the perception of it as such prevents some people from seeing it as an enterprise BI tool. On the Power BI CAT team we certainly work with a lot of large customers that use Power BI as an enterprise BI tool and semantic layer successfully: Walmart’s finance team is a greate example and their recent case study here (this older video is good too) explicitly mentions that they use Power BI as a “semantic model library” on billions of rows of data.

Preference for thin(ness)

Another great point that Aurimas makes is that the current preference in BI tools is for them to be thin layers that “delegate the computational workloads to the (cloud) databases/warehouses where the data is stored”. Back when I first started in BI the debate was between MOLAP and ROLAP and while the pendulum has swung in different directions over the years we’re still arguing over the same points with Import mode versus DirectQuery. My personal opinion is the currently unfashionable one: Import mode and the Vertipaq engine will always outperform an approach that involves generating SQL against an external database, however fast and scalable that database claims to be, for anything more than basic BI requirements (I’m watching Google Malloy with great interest though, along with whatever SQL additions Julian Hyde is working on). The official Microsoft guidance is that Import mode should be your default choice and at present, as this video by Alberto Ferrari shows, the performance differences between Import mode and DirectQuery mode are significant. As the Walmart case study referenced above mentions, you can always mix Import mode and DirectQuery mode in composite models and build aggregations if you’re working with data volumes tha are too large for Import mode alone. We are continuing to invest in improvements to DirectQuery such as Horizontal Fusion and I think that will close the gap between Import and DirectQuery a lot.

DAX or SQL?

In the same way the MOLAP vs ROLAP debate has dragged on for twenty-plus years, people have always argued whether SQL is the right language for expressing BI queries and calculations or if another language – MDX when I started, DAX today – is necessary. To be honest I think if SQL was the right choice the argument would be settled by now and we’d already have a whole ecosystem of BI products allowing you to define complex measures in SQL in a way that developers found easy to understand. Even if you accept that another language is necessary (and the people working on Google Malloy agree on that point) then there’s the question of whether DAX is a good solution to the problem or whether a different approach would be better. DAX is certainly hard to learn but that’s more because of the concepts involved rather than the syntax itself; Marco Russo’s post here is a great explanation of why DAX is simple but not easy. Since the concepts are the issue I strongly suspect that any other language that was as powerful as DAX would be just as difficult to learn. What’s more we’re working on making DAX debugging easier, for example with the EvaluateAndLog function, and making writing calculations easier with the upcoming visual calcs feature, and there are a lot of other similar improvements we could and should implement in the future.

Conclusion

Will these points change anyone’s mind? Probably not, especially since these questions are religious more than anything else: you’re either a Microsoft fan or someone who would never, ever consider using a Microsoft product; you’re either a SQL die-hard or you aren’t. Does this matter? I’ve seen Power BI’s all-conquering usage figures and I’m not sure it does. I love theoretical questions about semantic layers as much as anyone else but what really matters is whether a tool is used and providing value to businesses.

Sharing Excel Reports Connected To Power BI Datasets Or The Excel Data Model/Power Pivot Using OneDrive For Business

I love Excel as an alternative to Power BI reports, especially now that Excel Online allows you to interact with browser-based Excel reports that use Power BI datasets or the Excel Data Model (aka Power Pivot) as a source. After all, why try to recreate a PivotTable in a Power BI report when you can give your users an actual PivotTable? You can publish Excel reports to Power BI and view them there; however if you want to share these reports using OneDrive for Business, outside Power BI, you’ll need to think carefully about how you do so before you allow other people to view the report.

To illustrate the problem I used Power Pivot to load some data into the Excel Data Model, built a simple report with a PivotTable and PivotChart, saved it to OneDrive for Business and then opened it in the browser with Excel Online. As you can see it’s possible to interact with the report in the browser, changing slicers and moving fields around in the PivotTable and PivotChart field lists:

So far so good. However, an Excel file saved to OneDrive for Business is a shared document – and any changes that one user makes are immediately visible to all other users who have access with full Edit permissions. This means that if you change a slicer and someone else is viewing my report at the same time, they will see the slicer change too in real-time. This may be useful in scenarios where you are collaborating with someone on the same report and want them to see your changes, but in most cases this is not desirable behaviour for a report. Here’s an example with the same Excel report open side by side in Chrome and Edge:

How can you stop this happening? One option is to use View mode. When an Excel workbook is in View mode a user can interact with slicers and move fields around in the PivotTable without these changes affecting other users and without these changes being saved; they cannot make most other changes such as entering values in cells. If users do have full Edit permissions they can always switch to View mode using the dropdown menu in the top right corner of the screen:

You can also use the Protect Workbook option to make sure users open the workbook in View mode by default. However there is always the danger that if a user has Edit permissions they will switch to Edit mode and make unwanted changes, so as a result it’s better to share the workbook without Edit permissions using the “Can View” option described here so they can only open the workbook in View mode:

There is another option: using an Embed link. To get this, click on the File menu in Excel Online and then on the backstage view select Share and then Embed:

As the UI suggests, this option is intended for scenarios where you want to embed your workbook in another application; it’s similar to View mode but a bit more restrictive. In the Embed dialog that opens you can choose which parts of the workbook to share, whether grid lines are shown and other useful options:

Here you need to select the “Let people sort and filter” option otherwise your users won’t be able to use the slicers. Next, copy the code from the “Embed code” box and paste into your favourite text editor so you can extract the URL in the src tag – this is the URL you should give to your users. When a user opens an Excel report using a link generated in this way they won’t see the Excel ribbon at all; they can interact with slicers but can’t get access to the PivotTable fields pane and so won’t be able to move fields around, for example changing what is on rows or columns. I think this gives the best experience for end users who just want to view an Excel report in the browser.

Note that this does not replace normal OneDrive for Business sharing and permissions though: you’ll still need to share the report with your users, ideally with “Can View” permissions as described above. If your Excel report connects back to a Power BI dataset you also need to ensure that your users have the appropriate permissions on that dataset, which means they’ll either need to be at least a Member in the workspace the dataset is stored in or have Build permissions.

Web.Contents, Text Concatenation And Dataset Refresh Errors In Power BI/Power Query

One of the most popular topics I’ve ever written about here is the dataset refresh errors you get with dynamic data sources and the Web.Contents function in Power BI (see here and here for example). Recently I learned about an interesting new detail regarding this problem that I thought was worth blogging about, and which may help someone trying to troubleshoot it.

Consider the following M query, used as the source of a table in a Power Query dataset:

let
  Term = "apples",
  Source = Json.Document(
    Web.Contents(
      Text.Combine(
        {
          "https://data.gov.uk/api/3/action/package_search?q=",
          Term
        }
      )
    )
  ),
  CallSucceeded = #table(
    type table [CallSucceeded = logical],
    {{Source[success]}}
  )
in
  CallSucceeded

[The API used here is public and doesn’t require authentication so you can run this query yourself]

This query refreshes successfully in Power BI Desktop but when you publish to the Power BI Service and go to the dataset Settings page you see the following error:

This dataset includes a dynamic data source. Since dynamic data sources aren’t refreshed in the Power BI service, this dataset won’t be refreshed. Learn more: https://aka.ms/dynamic-data-sources. Data source for Query1

Why is this a case of a dynamic data source? Unlike the examples in my previous post there is only one, known, value being passed to the API, but nevertheless the use of the Text.Combine M function is enough to prevent the Power Query engine from doing the static analysis it needs to do to allow refresh to take place. As documented here, the Power Query engine needs to be able to work out the URL it’s going to call before the query is run and in this case it can’t.

One way of solving this problem, the way I knew would work, is to use the Query option with Web.Contents like so:

let
  Term = "apples",
  Source = Json.Document(
    Web.Contents(
      "https://data.gov.uk/api/3/action/package_search",
      [Query = [q = Term]]
    )
  ),
  CallSucceeded = #table(
    type table [CallSucceeded = logical],
    {{Source[success]}}
  )
in
  CallSucceeded

What I didn’t know – or rather I did, but didn’t really understand – is that if all you want to do is concatenate text to build your URL you can use the & operator rather than Text.Combine and it will work because Power Query is smart enough to understand that during static analysis. So for example:

let
  Term = "apples",
  Source = Json.Document(
    Web.Contents(
      "https://data.gov.uk/api/3/action/package_search?q="
        & Term
    )
  ),
  CallSucceeded = #table(
    type table [CallSucceeded = logical],
    {{Source[success]}}
  )
in
  CallSucceeded

…will also successfully refresh in the Power BI Service because it uses the & operator. This is the way I would naturally write the code and I’m sure I’ve done this hundreds of times in the past without realising that concatenating text any other way will lead to errors.

[Thanks to Curt Hagenlocher for this information]