Here’s something that will Blow Your Mind if you’re a Power Query/M fan. Did you know that there’s a way you can get query folding to work if you’re using a native SQL query on SQL Server or Postgres as your data source?
There’s a new option on the Value.NativeQuery() M function that allows you to do this: you need to set EnableFolding=true in the third parameter. It’s documented here for the Postgres connector but it also works for the SQL Server connector too. Here’s an example using the SQL Server AdventureWorksDW2017 sample database:
let
  Source = Sql.Databases("localhost"),
  AdventureWorksDW2017 = Source
    {[Name = "AdventureWorksDW2017"]}
    [Data],
  RunSQL = Value.NativeQuery(
    AdventureWorksDW2017,
    "SELECT EnglishDayNameOfWeek FROM DimDate",
    null,
    [EnableFolding = true]
  ),
  #"Filtered Rows" = Table.SelectRows(
    RunSQL,
    each (
      [EnglishDayNameOfWeek] = "Friday"
    )
  )
in
  #"Filtered Rows"
Notice that my data source is a SQL query that gets all rows for the EnglishDayNameOfWeek column from the DimDate table and I’m only filtering down to the day name Friday using the #”Filtered Rows” step using the Table.SelectRows() function. Normally the #”Filtered Rows” step wouldn’t fold because I’ve used a native SQL query as my source, but in this case it does because I’ve set EnableFolding=true in Value.NativeQuery.
Here’s the SQL query generated by this M query:
select [_].[EnglishDayNameOfWeek]
from
(
    SELECT EnglishDayNameOfWeek FROM DimDate
) as [_]
where [_].[EnglishDayNameOfWeek] = 'Friday'
Of course this doesn’t mean that everything can be folded now, but it’s nice to see that some folding on native SQL queries is now possible.
As I said this only works for SQL Server and Postgres at the time of writing and there is one other limitation: folding won’t happen if you’re passing parameters back to your SQL query in the way I describe here.
Last year Marco Russo wrote a very useful blog post pointing out the performance problems you can run into when connecting to data stored in ADLSgen2 from Power BI when there are a large number of files elsewhere in the container. You can read that post here:
Marco’s advice – which is 100% correct – is that you should either pass the full path to the folder that you want to connect in the initial call to AzureStorage.DataLake() or, if you’re connecting to a single file, pass the path to the file itself. This avoids the performance overhead of reading metadata from files you’re not interested in reading from, which can be quite considerable.
There are some scenarios where this advice doesn’t work, though, and there is another way to avoid this overhead and make the performance of reading data much faster – and this is by using the HierarchicalNavigation option of the AzureStorage.DataLake() function. I blogged about what this option does some time ago but didn’t realise at the time the performance benefits of using it:
Consider the following scenario. Let’s say you want to connect to a CSV file in a folder which also contains a subfolder that contains many (in this example 20,000) other files that you’re not interested in:
[I’m only going to connect to a single file here to keep the example simple; I know I could just connect direct to the file rather than the folder and avoid the performance overhead that way]
Here’s the M code generated by the Power Query Editor using the default options to get the contents of the aSales.csv file:
In Power BI Desktop refreshing the table that this M query returns (even with the Allow Data Preview To Download In The Background option turned off) takes 23 seconds. I measured refresh time using a stopwatch, starting with the time that I clicked the refresh button and ending when the refresh dialog disappeared; this is a lot longer than the refresh time that you might see using the Profiler technique I blogged about here, but as a developer this is the refresh time that you’ll care about.
The problem here is the Source step which returns a list of all the files in the ParentFolder folder and the ManySmallFiles subfolder.
Now, here’s an M query that returns the same data but where the HierarchicalNavigation=true option is set:
This takes just 3 seconds to refresh in Power BI Desktop – a really big improvement.
Conclusion: always use the HierarchicalNavigation=true option in AzureStorage.DataLake() when connecting to data in ADLSgen2 storage from Power BI to get the best refresh performance and the best developer experience in Power BI Desktop.
Following on from my last two posts comparing the performance of importing data from ADLSgen2 into Power BI using the ADLSgen2 connector and going via Synapse Serverless (see here and here), in this post I’m going to look at a third option for connecting to CSV files stored in ADLSgen2: connecting via a Common Data Model folder. There are two ways to connect to a CDM folder in Power BI: you can attach it as a dataflow in the Power BI Service, or you can use the CDM Folder View option in the ADLSgen2 connector.
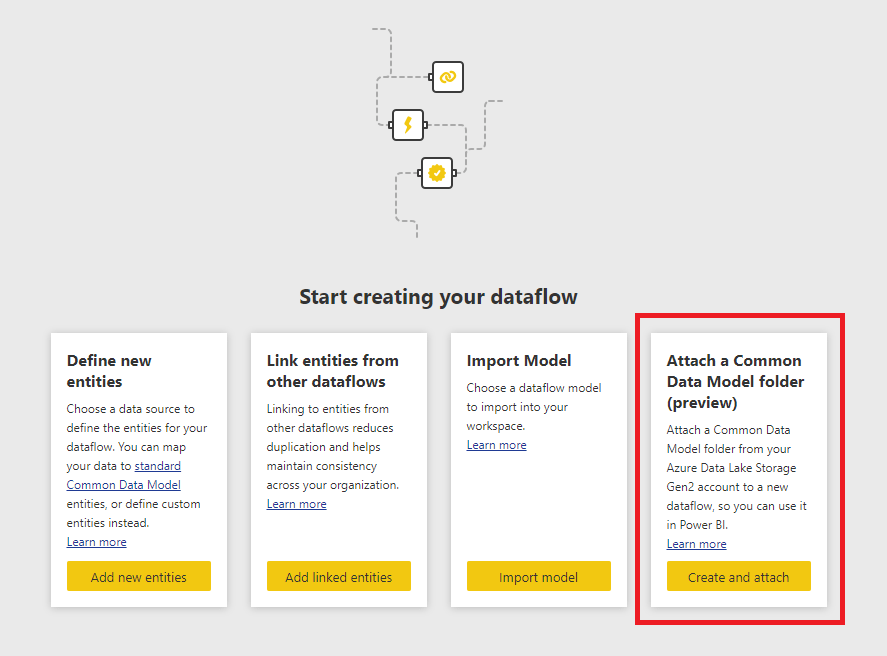
First of all, let’s look at connecting via a dataflow. Just to be clear, I’m not talking about creating a new entity in a dataflow and using the Power Query Editor to connect to the data. What I’m talking about is the option you see when you create a dataflow to attach a Common Data Model folder as described here:
This is something I blogged about back in 2019; if you have a folder of CSV files it’s pretty easy to add the model.json file that allows you to attach this folder as a dataflow. I created a new model.json file and added it to the same folder that contains the CSV files I’ve been using for my tests in this series of blog posts.
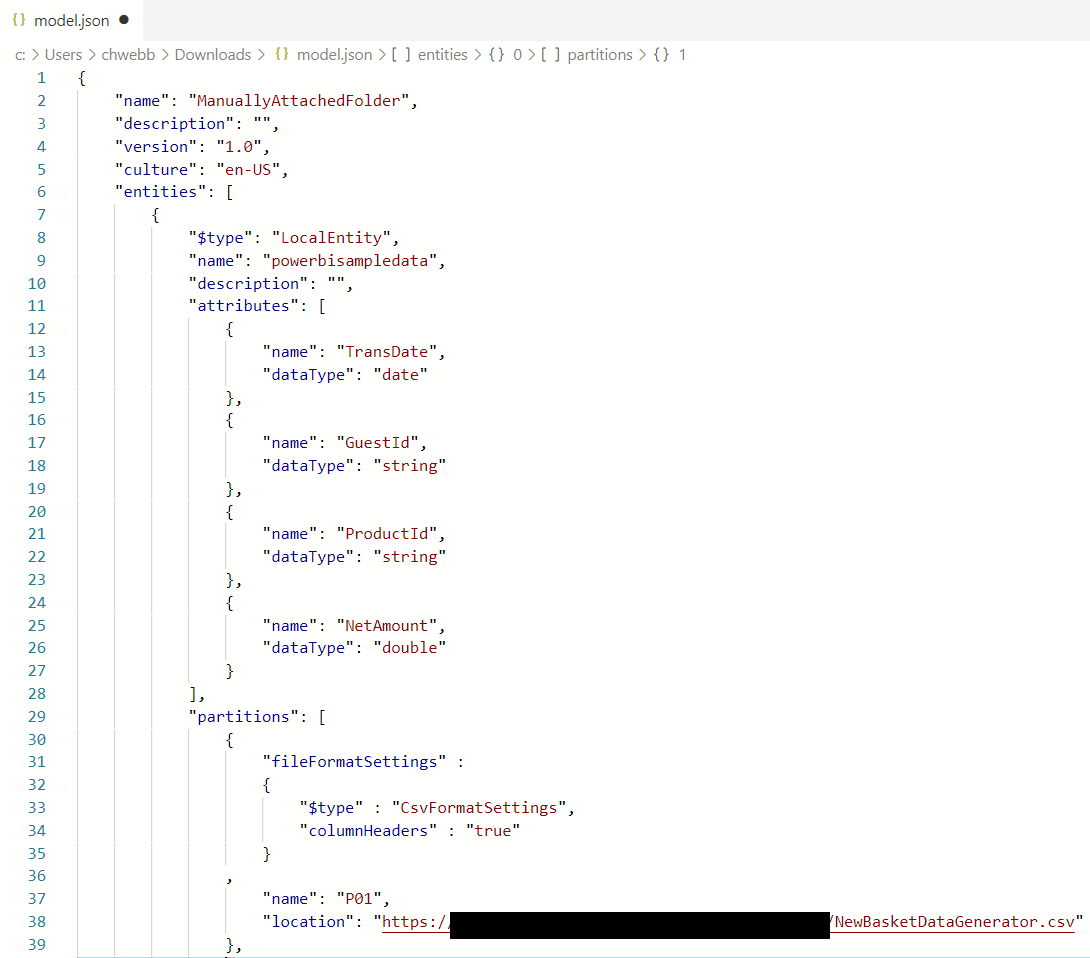
Here’s what the contents of my model.json file looked like:
Something to notice here is that I created one CDM partition for each CSV file in the folder; only the first CDM partition is visible in the screenshot. Also, I wasn’t able to expose the names of the CSV source files as a column in the way I did for the ADLSgen2 connector and Synapse Serverless connector, which means I couldn’t compare some of the refresh timings from my previous two posts with the refresh timings here and had to rerun a few of my earlier tests.
How did it perform? I attached this CDM folder as a dataflow, connected a new dataset to it and ran some of the same tests I ran in my previous two blog posts. Importing all the data with no transformations (as I did in the first post in this series) into a single dataset took on average 70 seconds in my PPU workspace, slower than the ADLSgen2 connector which took 56 seconds to import the same data minus the filename column. Adding a step in the Power Query Editor in my dataset to group by the TransDate column and add a column with the count of days (as I did in the second post in this series) took on average 29 seconds to refresh in my PPU workspace which is again slightly slower than the ADLSgen2 connector.
Conclusion #1: Importing data from a dataflow connected to a CDM folder is slower than importing data using the ADLSgen2 connector with the default File System View option.
What about the Enhanced Compute Engine for dataflows? Won’t it help here? Not in the scenarios I’m testing, where the dataflow just exposes the data in the CSV files as-is and any Power Query transformations are being done in the dataset. Matthew Roche’s blog post here and the documentation explains when the Enhanced Compute Engine can help performance; if I created a computed entity to do the group by in my second test above then that would benefit from it for example. However in this series I want to keep a narrow focus on testing the performance of loading data from ADLSgen2 direct to Power BI without staging it anywhere.
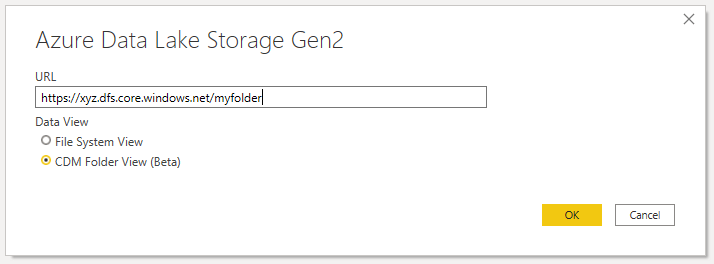
The second way to import data from a CDM folder is to use the CDM Folder View option (which, at the time of writing is in beta) in the ADLSgen2 connector:
I expected the performance of this method to be the same as the dataflow method, but interestingly it performed better when loading all the data with no transformations: on average it took 60 seconds to refresh the dataset. This was still a bit slower than the 56 seconds the ADLSgen2 connector took using the default File System View option to return the same data minus the filename column. I then ran the test to create a group by on the Transdate column and that resulted in an average dataset refresh time of 27 seconds, which is exactly the same as the ADLSgen2 connector with the default File System View option.
Conclusion #2: Importing data from a Common Data Model folder via the ADLSgen2 connector’s CDM Folder View option may perform very slightly slower, or about the same as, the default File System View option.
So no performance surprises again, which is a good thing. Personally, I think exposing your data via a CDM folder is much more user-friendly than giving people access to a folder full of files – it’s a shame it isn’t done more often.
Some interesting new Power Query functionality was released in the December release of Power BI Desktop (it’s also in the build of Excel I’m running) that didn’t get announced in the blog post but which will be useful for anyone using Excel as a data source. It is fully documented but I thought I’d blog about it anyway to raise awareness.
It’s a new option on the Excel.Workbook function called InferSheetDimensions. Here’s what the docs for the Excel.Workbook function say:
Can be null or a logical (true/false) value indicating whether the area of a worksheet that contains data should be inferred by reading the worksheet itself, rather than by reading the dimensions metadata from the file. This can be useful in cases where the dimensions metadata is incorrect. Note that this option is only supported for Open XML Excel files, not for legacy Excel files. Default: false.
There’s also a much more detailed explanation on this page:
…in the section “Missing or incomplete Excel data” on how to troubleshoot issues where Power Query isn’t loading all the data from your worksheet.
Here’s a quick summary of the problem. Open XML format Excel workbooks (ie xlsx and xlsm format files) have some metadata (the “dimensions metadata” referred to in the docs) in them that acts as a kind of bounding box describing the range of cells in each worksheet that contain values. By default, Power Query uses this metadata when it gets data from an Excel worksheet – although not when it gets data from an Excel table or named range. Most of the time this metadata is reliable but in some cases, for example where an xlsx file has been generated by third-party software that has “export to Excel” functionality, it contains inaccurate information. This doesn’t affect Excel, which still loads the workbook, but it means that Power Query may not load all the data present in a worksheet. In these cases, setting InferSheetDimensions=true in Excel.Workbook causes Power Query to ignore the dimensions metadata and load all the data from the worksheet.
The docs also point out that if the dimension metadata returns a range that much larger than the actual populated range of cells in the worksheet, this can cause performance problems when loading data. While this can be fixed by manually editing the workbook as shown here, that’s not much help if you’re dealing with Excel files generated by buggy third-party software. Since Excel is already one of the slowest data sources you can use with Power Query, I guess this is another reason to use text formats like CSV with Power Query instead.
In the examples for this post I’ll be using a free, fake web service available at http://jsonplaceholder.typicode.com/ which requires no authentication so you will be able to run the code I show yourself. Let’s start by considering the following call to the comments resource of this API:
In M, you can use the Web.Contents function and the Query option to call the API like so:
//Generates the URL http://jsonplaceholder.typicode.com/comments?postId=1
Web.Contents("http://jsonplaceholder.typicode.com/comments",[Query=[postId="1"]])
Now this API – unlike many others – allows you to pass multiple URL query parameters of the same name. For example this is a valid call:
…you’ll get an error, because the Query option take a record and a record can’t have two fields with the same name.
Here’s where it gets interesting. In the working example above, the postId field in the Query record contains a text value. The field can contain a list of text values instead, though, and this is how you solve the problem:
//Generates the URL http://jsonplaceholder.typicode.com/comments?postId=1&postId=2
Web.Contents("http://jsonplaceholder.typicode.com/comments",[Query=[postId={"1","2"}]])
This results in a URL with two query parameters that are both called postId but have the values 1 and 2 respectively.
There’s something else worth mentioning about this too. Sometimes when you’re generating a URL you may not want to add a query parameter to it if a value is null. One way of handling this is to start with an empty record and then add fields to it using the Record.AddField function, but using an empty list provides another approach. For example:
//Generates the URL http://jsonplaceholder.typicode.com/comments
//and *not* http://jsonplaceholder.typicode.com/comments?postId=
Web.Contents("http://jsonplaceholder.typicode.com/comments",[Query=[postId={}]])
…generates a URL without the postId query parameter in. This means you can write a simple function with an optional parameter for postId like this:
(optional myPostId as text) =>
Json.Document(
    Web.Contents("http://jsonplaceholder.typicode.com/comments",[Query=[postId=myPostId ?? {}]])
    )
If a text value is passed to myPostId then the postId query parameter is added to the URL; if no value is passed, myPostId is null and the ?? null coalescing operator (see Ben Gribaudo’s post here for more information on this operator) can be used to replace it with an empty list.
One last thing to mention: if you need to see the web service calls generated by Web.Contents when you’re testing in the Power Query Editor, you can use the query diagnostics functionality as I show here.
[I’m extremely grateful to Dave Maiden for letting me know about all this – it answers a question I have been asked several times in the past]
If the title wasn’t enough to warn you, this post is only going to be of interest to M ultra-geeks and people using Power BI with Azure Data Explorer – and I know there aren’t many people in either group. However I thought the feature I’m going to show you in this post is so cool I couldn’t resist blogging about it.
Let’s say I have a table in Azure Data Explorer called Product that looks like this:
Because this table is in Azure Data Explorer I can query it with KQL, and the thing I love most about KQL as a language is the way that each query is built up as a series of piped transformations. So, for example, on the table above I could write the following query:
Product
| where Type=='Berry'
| where FruitID >1
…and get this result:
It seems quite similar to the way M works, right? Anyway, now for the cool part. When you connect Power Query in Power BI up to Azure Data Explorer, not only does query folding take place but you can mix and match native KQL fragments (added using the Value.NativeQuery M function) and Power Query transformations created in M, and it all still folds! This completely blew my mind when I found out about it. It’s documented briefly here but the docs don’t explain everything that you can do with it.
Consider the following M query:
let
  Source
    = AzureDataExplorer.Contents(
        "https://xyz.ukwest.kusto.windows.net/",
        "MyDatabase",
        "Product"
      ),
  #"Filtered Rows"
    = Table.SelectRows(
        Source,
        each ([Type] = "Berry")
      ),
  Q1 = Value.NativeQuery(
      #"Filtered Rows",
      "| where FruitID>2"
    )
in
  Q1
There are three steps:
Source connects to the Product table
#”Filtered Rows” is a filter generated by the Power Query UI to filter the table down to just the rows where Type is “Berry”
Q1 uses Value.NativeQuery to add a KQL filter onto the output of #”Filtered Rows” so only the rows where FruitID is greater than 2
Here’s the KQL this folds to:
Product
| where strcmp(["Type"], ("Berry")) == 0
| where FruitID>2
You can also use Value.NativeQuery more than once. Here’s another M query that returns the same result as above:
let
  Source
    = AzureDataExplorer.Contents(
        "https://xyz.ukwest.kusto.windows.net/",
        "MyDatabase",
        "Product"
      ),
  Q3 = Value.NativeQuery(
      Source,
      "| where Type=='Berry'"
    ),
  Q4 = Value.NativeQuery(
      Q3,
      "| where FruitID>2"
    )
in
  Q4
Very useful when you want to build a query quickly using the Power Query Editor but then need to use a KQL feature that isn’t supported by Power Query.
This week a customer came to me with the following problem: they had scheduled the refresh of their dataset but their source data wasn’t always ready in time, so the old data was being loaded by mistake. The best solution here is to use some kind of external service (for example Power Automate) to poll the data source regularly to see if it’s ready, and then to refresh the dataset via the Power BI REST API when it is. However, it got me thinking about a different way of tackling this: is it possible to write some M code that will do the same thing? It turns out that it is, but it’s quite complicated – so I don’t recommend you use the code below in the real world. Nevertheless I wanted to write up the solution I came up with because it’s interesting and you never know, it might be useful one day.
Here’s the scenario I implemented. Using a SQL Server data source, let’s say that you want to load the result of the following SQL query against the AdventureWorksDW2017 database into Power BI:
SELECT DISTINCT [EnglishDayNameOfWeek] FROM DimDate
However, let’s also say that the data in this table may not be ready at the time when dataset refresh is scheduled; when the data is ready, the sole value in the sole column of another table, called ContinueFlagTable, will be changed from False to True:
Therefore when dataset refresh starts we need to check the value from the ContinueFlagTable regularly; if it is False we need to wait for a given amount of time and then check again; if it is True the data can be loaded; if the flag hasn’t changed to True after checking a certain number of times then we need to raise an error.
Here’s the full M code of the Power Query query:
let
  //The SQL Server database
  Source = Sql.Database(
      "MyServerName",
      "AdventureWorksDW2017"
    ),
  //The query to load into the dataset
  ResultQuery
    = Value.NativeQuery(
        Source,
        "SELECT DISTINCT [EnglishDayNameOfWeek] FROM DimDate"
      ),
  //The number of times to check the Continue flag
  MaxIterations = 3,
  //The number of seconds to wait before checking the Continue flag
  DelaySeconds = 5,
  //Check the Continue flag
  Iterate = List.Generate(
      () => 1,
      each (
      //Query the ContinueFlag table
      //after waiting the specified number of seconds
      //and keep trying until either it returns true
      //or we reach the max number of times to check(Function.InvokeAfter(
          () =>
            let
              dbo_ContinueFlag
                = Value.NativeQuery(
                    Source,
                    "SELECT [ContinueFlagColumn] from ContinueFlagTable where -1<>@param",
                    [
                      param
                        = _
                    ]
                  ),
              Continue
                = dbo_ContinueFlag{0}[ContinueFlagColumn]
            in
              Continue,
          #duration(
              0,
              0,
              0,
              DelaySeconds
            )
        )
        = false
      )
        and (_ < MaxIterations)
      ),
      each _ + 1
    ),
  //Find how many times the ContinueFlag was checked
  NumberOfIterations
    = List.Max(Iterate),
  //Did we reach the max number of checks?
  ReturnError
    = NumberOfIterations
      = MaxIterations
      - 1,
  //Table type of the table to load into the dataset
  ReturnTableType
    = type table [
      EnglishDayNameOfWeek = Text.Type
    ],
  //Error message to return if the
  //max number of checks is reached
  ErrorMessage
    = error "After waiting "
      & Text.From(
        MaxIterations
        * DelaySeconds
      )
      & " seconds your data is still not ready to be loaded",
  //Handle Power BI Desktop's behaviour of asking for
  //the top 0 rows from the table
  //before loading the actual data
  OverrideZeroRowFilter =
    if ReturnError then
      ErrorMessage
    else
      Table.View(
          null,
          [
            GetType = () =>
              ReturnTableType,
            GetRows = () =>
              ResultQuery,
            OnTake
              = (
                count as number
              ) =>
                if count = 0 then
                  #table(
                      ReturnTableType,
                      {}
                    )
                else
                  Table.FirstN(
                      ResultQuery,
                      count
                    )
          ]
        )
in
  OverrideZeroRowFilter
There’s a lot to explain here:
Everything is in a single query, and this is deliberate: I found it was the only way I could make sure that the query to load the data (ie the query in the ResultQuery step) is run only once, after the check on the ContinueFlagTable has returned true. If I split the code to get the data off into a separate query, I found that it got queried before any checks on ContinueFlagTable; this seemed to be something to do with the formula firewall, but I’m not sure.
I’ve used List.Generate to do the polling of ContinueFlagTable. There’s a good example of how to use it to implement Do Loops here.
I’ve used Function.InvokeAfter to add the delays in between checks on ContinueFlagTable.
I found that if I ran the same query to check ContinueFlagTable, after the first execution the result was cached and the query couldn’t tell if the flag changed after that. Therefore I wrote a SQL query with a WHERE clause that was different each time but which always returned true; I did this by passing the iteration number into the query via a parameter, and I passed the parameter in using the Value.NativeQuery function.
It’s possible to raise an error when needed using the error keyword, described here.
The OverrideZeroRowFilter step at the end uses the technique I blogged about here to deal with the fact that Power BI Desktop asks for the top 0 rows from a table to get the schema before it loads the data.
Refreshing the table in Power BI Desktop with the value True in ContinueFlagTable loads the data successfully; in Profiler you can see one query to ContinueFlagTable and one query to get the data to be loaded from the DimDate table:
Refreshing the table with the value False in ContinueFlagTable shows the specified number of queries to ContinueFlagTable and no query to DimDate:
Here’s the error message you get in Power BI Desktop when this happens:
Here’s the same error in the Power BI Service when you try to refresh the dataset set:
Even though the documentation for dynamic M parameters does mention how to handle multi-select in the M code for your Power Query queries, I thought it would be useful to provide a detailed example of how to do this and explain what happens behind the scenes when you use multi-select.
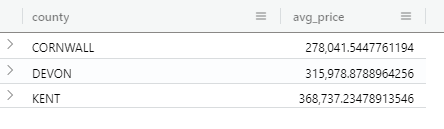
Once again I’m going to use Azure Data Explorer as my DirectQuery data source in this post. Consider the following simple KQL query, which returns a list of counties in the UK and the average price paid for real estate in them:
pricepaid
| where county in ('DEVON', 'CORNWALL', 'KENT')
| summarize avg(price) by county
The third line of this query uses a combination of the KQL where and in operators to filter the list of counties in a way that’s very similar to other query languages such as SQL. The challenge is to write an M expression that will generate the comma-delimited list of county names in parantheses at the end of this line.
Taking the query above and generating a non-dynamic DirectQuery table in Power BI is straightforward, and let’s assume that you have already created an M parameter called Selected County:
… a table of county names:
…and bound the County column of this table to the SelectedCounty M parameter and turned on the Multi-select option in Model View in the main Power BI Desktop window:
Now the confusing thing for me, when I first started to look at this problem, was that the M parameter called SelectedCounty I created was of type Text but the example code in the documentation was written for an M parameter of type list – when in fact it isn’t possible to create an M parameter of type list in the Power Query Editor (at least not at the time of writing). It turns out that when the Multi-select option is turned on Power BI is able to send a value of type list to the parameter regardless of what type you have defined for it.
With that knowledge here’s an example of an M query to generate the query using the parameter:
let
  CountyList =
    if
    //check to see if the parameter is a list
      Type.Is(
        Value.Type(SelectedCounty),
        List.Type
      ) then
        //if it is a list
        let
          //add single quotes around each value in the list
          AddSingleQuotes = List.Transform(
              SelectedCounty,
              each "'" & _ & "'"
            ),
          //then turn it into a comma-delimited list
          DelimitedList = Text.Combine(
              AddSingleQuotes,
              ","
            )
        in
          DelimitedList
    else
      //if the parameter isn't a list
      //just add single quotes around the parameter value
      "'" & SelectedCounty & "'",
  //generate and run the KQL query
  Source = AzureDataExplorer.Contents(
      "https://mycluster.northeurope.kusto.windows.net",
      "pricepaid",
      "pricepaid#(lf)
       | where county in
       ("
        & CountyList &
       ")#(lf)
       | summarize avg(price) by county",
      [
        MaxRows                 = null,
        MaxSize                 = null,
        NoTruncate              = null,
        AdditionalSetStatements = null
      ]
    )
in
  Source
Note that the CountyList step has to check the data type of the parameter using an if statement, because in the Query Editor it will always be Text whereas in the report it will be a list if multi-select is turned on and Text if not.
Here’s the final report showing a multiselect slicer passing values into this query:
[Thanks to Ravi Kiran Vemulapalli and Sujata Narayana for their help with this post]
My favourite feature in the October 2020 release of Power BI is undoubtedly dynamic M parameters. However, before I explain why, I’m going to put my hands up and admit that we screwed up the communication around its launch and didn’t explain its limitations properly – which led to some understandable disappointment and confusion.
Although the blog post and the docs have now been updated to make it clear that this feature doesn’t work with many popular data sources like SQL Server, Synapse, Oracle, Teradata and SAP (see here for the full details), I thought I’d explain why. It’s because there are two sets of connector that Power BI uses for DirectQuery: an older set that was built some time ago for the data sources originally supported by Analysis Services Tabular, and a newer set that is built in Power Query’s M language. Dynamic M parameters only work for this newer set of connectors; if you want to see this feature extended so it works for the older connectors too then please vote on ideas.powerbi.com, talk to your Microsoft account team, call Satya or whatever your normally do.
OK, so why am I excited? Well, because dynamic M parameters let you do a whole bunch of cool things that weren’t possible before. My original plan for this blog post was to show how they can be used to change the dimension column used in a visual dynamically but Mim beat me to it with this blog post. Instead in this post I’m going to show you how you can use them to create something like dynamic calculated columns and I also want to make a more general point that will Blow Your Mind (hopefully).
For my example I’m going to use Azure Data Explorer (ADX) as my data source. There are a couple of reasons why: it’s something I’ve been interested to learn more about for a while, and the ADX team recently announced a bunch of new features which make me think it will be increasingly useful in BI scenarios; it will be important to know it if you’re using the new Azure Monitor integration for Power BI log data; and, crucially, it’s one of the few M-based connectors where you can write your own queries in DirectQuery mode (although this is coming to Snowflake and Redshift next year too).
My source data is from the UK Land Registry Price Paid dataset, and for my demo report I loaded a table containing around 790,000 real estate transactions into ADX. Each real estate transaction has the price paid for the property:
One obvious way to analyse this data is to build a histogram and show the number of transactions that occur in price bins such as £0-£100000, £100000-£200000, £200000-£300000 and so on. This is quite easy to do in Power BI, for example using calculated columns in Import mode, unless you want to allow your users to be able to change the bin sizes themselves. Dynamic M parameters give you an easy way to solve this problem though.
KQL, the query language for ADX, has a really nice way of generating bins for histograms using the summarize() operator and bin() function. For example, the following KQL query does something like a SQL group by and shows the number of real estate transactions for each county and bins based on price in £25000 increments:
pricepaid
| summarize Transactions=count()
by county, bin(price, 25000)
In Power BI I created a parameter called binsizes:
…and then created a parameterised version of the KQL query above to populate a DirectQuery table. Here’s the M code for this table:
let
    Source =
     AzureDataExplorer.Contents(
      "https://mycluster.northeurope.kusto.windows.net",
      "pricepaid",
      "pricepaid | summarize Transactions=count() by county, bin(price, "
      & Number.ToText(binsizes) &
      ")",
      [MaxRows=null, MaxSize=null, NoTruncate=null, AdditionalSetStatements=null]
     )
in
    Source
Next I created a new table with the possible bin sizes that the user can choose using a DAX calculated table:
And then finally linked the column in this new table with the M parameter:
Here’s the final report, where you can see the number of transactions in each price bin and use slicers to change the price bins and change the county you’re looking at:
Apart from being a new solution to an old problem, what does this mean? Well, with a data source like ADX where M parameters are supported and you can write your own queries in DirectQuery mode, you can do whatever you want in the query so long as it always returns the same columns. As well as creating parameterised queries, in ADX you could also create a user-defined function (something like table-valued functions in SQL Server), pass parameters into it using M parameters, and have a totally dynamically generated fact table in your dataset. Either way, using dynamic M parameters in this way allows you to use KQL’s specialised functions for basket analysis or geospatial analysis to do things that are otherwise impossible in Power BI. I’m sure similar things are possible with other data sources too. And that, my friends, is why I’m so excited about dynamic M parameters.
Most of the time I’ve spent looking at Power Query Query Diagnostics data, I’ve been looking at data for a single query. Over the past few days though I’ve spent some time investigating what this data shows for all the queries that are executed for a single dataset refresh. To help me do this I wrote the following M function:
(InputTable as table) =>
  let
    Source = InputTable,
    EarliestStart = List.Min(Source[Start Time]),
    AddRelativeStart = Table.AddColumn(
        Source,
        "Relative Start",
        each [Start Time] - EarliestStart
      ),
    AddRelativeEnd = Table.AddColumn(
        AddRelativeStart,
        "Relative End",
        each [End Time] - EarliestStart
      ),
    SetToDurations = Table.TransformColumnTypes(
        AddRelativeEnd,
        {
          {"Relative Start", type duration},
          {"Relative End", type duration}
        }
      ),
    CalculatedTotalSeconds
      = Table.TransformColumns(
          SetToDurations,
          {
            {
              "Relative Start",
              Duration.TotalSeconds,
              type number
            },
            {
              "Relative End",
              Duration.TotalSeconds,
              type number
            }
          }
        ),
    GroupedRows = Table.Group(
        CalculatedTotalSeconds,
        {"Id", "Query"},
        {
          {
            "Relative Start",
            each List.Min([Relative Start]),
            type number
          },
          {
            "Relative End",
            each List.Max([Relative End]),
            type number
          }
        }
      ),
    MergeColumns = Table.AddColumn(
        GroupedRows,
        "Id Query",
        each Text.Combine({[Id], [Query]}, " "),
        type text
      ),
    IdToNumber = Table.TransformColumnTypes(
        MergeColumns,
        {{"Id", type number}}
      )
  in
    IdToNumber
If you invoke this function and pass in the “Detailed” query diagnostics data query:
…you’ll end up with a query that gives you a table that looks something like this:
This table has one row for each Power Query query that got executed while the diagnostics trace was running, an Id column to uniquely identify each execution, the name of the query executed, an Id Query column that concatenates the previous two columns, and Relative Start and Relative End columns that give you the number of seconds from the start time of the first query executed up to the start time and end time of the query on the current row.
Loading the data into Power BI allows you to build a stacked bar chart with Id Query on the axis and Relative Start and Relative End together in the values:
If you then set the Sort By Column property of Id Query to the Id column (which is numeric, so this ensures that the values in Id Query are sorted correctly) and set the Data Color property of the Relative Start values to white (or whatever the background of your chart is) so that it’s invisible, then finally set the axis of your stacked bar chart to be sorted by Id Query in ascending order, you get a visual something like this:
This is a kind of Gantt chart where the x axis shows the number of seconds since the start of the first query execution and each bar shows the start and end times of each query, making it easy to see which queries are executing in parallel.
“What can this show us?” I hear you say. Well, that’s something for a future blog post. All that I can say right now is that it’s COMPLICATED and I don’t properly understand it myself yet. But it’s undoubtedly interesting.