One Power BI feature that almost passed me by (because it was released in August while I was on holiday) was the ability to create streaming datasets in the Power BI web app and push data to them via the Power BI REST API. This blog post has the announcement:
https://powerbi.microsoft.com/en-us/blog/real-time-in-no-time-with-power-bi/
The documentation is here:
https://powerbi.microsoft.com/en-us/documentation/powerbi-service-real-time-streaming/
And Charles Sterling has an example of how to use it with Flow and PowerApps here:
https://blogs.msdn.microsoft.com/charles_sterling/2016/10/17/how-to-create-and-customize-applications-with-powerapps-with-laura-onu-webinar-1020-10am-pst/
However, when I played around with this I found there were a few things that were either confusing or not properly documented, so I thought it would be useful to give an example of how to use this functionality to automatically synch data from a table in Excel to Power BI using a Power Query query.
Creating the streaming dataset in Power BI
Imagine that you have a table called Sales in an Excel workbook on your desktop:

There are three columns: Month and Product, which contain text values, and Sales, which contains an integer value. This is the data that we want to push up to Power BI.
The first step is to create a streaming dataset in Power BI to receive this data. Go to PowerBI.com and on the left-hand menu, under the Datasets heading, you’ll find a link called Streaming Datasets right at the bottom next to the Get Data button:

Click it and you’ll go to the Streaming data screen. Click on the “Add streaming dataset” button in the top-right to create a new streaming dataset:

Choose the API option in the pop-out pane then click Next:

Then give your dataset a name, enter the names and data types for the columns in the table and leave the Historic data analysis option turned off (we’ll come back to this later):

Hit Create and you’ll see a screen showing the URL to use to push data to the dataset and an example of the JSON to use to send the data:

Copy the URL and put it somewhere handy – you’ll need it in a moment.
Pushing data to the streaming dataset from Excel
Back in your Excel workbook, open the Power Query Query Editor window and create a new text parameter called PowerBIStreamingDatasetURL and paste in the URL for the streaming dataset:

Next, create a new blank query and use the following M code:
[sourcecode language=”text” padlinenumbers=”true”]
let
Source = Excel.CurrentWorkbook(){[Name="Sales"]}[Content],
ChangedType = Table.TransformColumnTypes(
Source,
{
{"Month", type text},
{"Product", type text},
{"Sales", Int64.Type}
}),
ConvertToJson = Json.FromValue(ChangedType),
SendToPowerBI = Web.Contents(PowerBIStreamingDatasetURL,
[Content=ConvertToJson,
ManualStatusHandling={400,404}]),
GetMetadata = Value.Metadata(SendToPowerBI),
GetResponseCode = GetMetadata[Response.Status],
CurrentTime = DateTime.ToText(DateTime.FixedLocalNow()),
Output = #table({"Status"},
{{
if GetResponseCode=200 then
"Data updated successfully at " & CurrentTime
else
"Failure at " & CurrentTime}})
in
Output
[/sourcecode]
This query does the following:
- Reads the data from the Sales table in the workbook
- Converts the data to JSON (for some background on how it does this, see here)
- Sends the data to the streaming dataset using Web.Contents() to make a POST request. See this post on how to make POST requests using Web.Contents() and this post on the technique I’m using to handle HTTP errors manually.
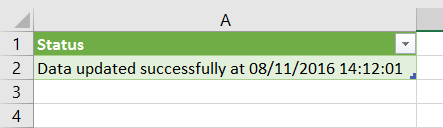
- Returns a table containing a message saying whether the data was updated successfully or not, and the time of execution like so:

Finally, back in Excel, go to the Data tab on the ribbon, click on the Connections button to open the Workbook Connections dialog, select the connection that represents the query you’ve just created, click Properties, then in the Connection Properties dialog tick the “Refresh every” box and set the query to refresh automatically every minute:

Displaying data in a Power BI dashboard
Back in the browser in Power BI, create a new dashboard, click the Add Tile button and choose the Custom Streaming Data option:

Click Next and select the streaming dataset created earlier:

Click Next again and then choose Clustered bar chart as your Visualization Type, select the Month field of the dataset for the Axis, Product for the Legend…

…the Sales field for the Value and set the time window to display to 1 second:

Frustratingly there’s no way to create a measure or otherwise aggregate data here. In this example you’re using all of the fields in dataset in the chart; if you left out Product, however, you wouldn’t see aggregated sales for all products you would just see data for one (the last?) row in the table for each month.
Finally, set a title for the chart:

You now have a dashboard that gets updated automatically and shows the data from the Sales table in the Excel workbook:

When you change the data in Excel, after the Power Query query has run in the background every minute, the new data will appear in the chart.
[Be aware that it might take a few minutes for everything to start working when you first create a new tile]
Other ways of visualising the data
There are other types of data visualisation your can use such as line charts that are all very straightforward. One thing that did confuse me was the card visual: it shows one number, but which number? In this example if you create a card and link it to the Sales field in the dataset, it will always display the value from the last row in the table:

Again, it would be really nice if there was a way of creating a measure here…
The Historic Data Analysis option
You may remember the Historic Data Analysis option from an earlier step. What happens if you turn it on? Basically, instead of storing just one copy of the table you push through the API it stores multiple copies of the table (although it doesn’t store everything – I guess it’s subject to this retention policy or something similar). For example, consider the following variation on the streaming dataset above:

There’s a new field called UpdateDateTime (which is of type text, not datetime, because I found this worked better in reports) and the Historic data analysis switch is turned on.
Here’s an updated version of the Power Query query that populates the UpdateDateTime field with the date and time that the query was run:
[sourcecode language=”text”]
let
Source = Excel.CurrentWorkbook(){[Name="Sales"]}[Content],
CurrentTime = DateTime.ToText(DateTime.FixedLocalNow()),
AddUpdateDateTime = Table.AddColumn(Source, "UpdateDateTime",
each "Data Update: " & CurrentTime),
ChangedType = Table.TransformColumnTypes(
AddUpdateDateTime ,
{
{"Month", type text},
{"Product", type text},
{"Sales", Int64.Type},
{"UpdateDateTime", type text}
}),
ConvertToJson = Json.FromValue(ChangedType),
SendToPowerBI = Web.Contents(PowerBIStreamingDatasetURL,
[Content=ConvertToJson,
ManualStatusHandling={400,404}]),
GetMetadata = Value.Metadata(SendToPowerBI),
GetResponseCode = GetMetadata[Response.Status],
Output = #table({"Status"},
{{
if GetResponseCode=200 then
"Data updated successfully at " & CurrentTime
else
"Failure at " & CurrentTime}})
in
Output
[/sourcecode]
You can download a demo workbook with this second example query in here.
The dashboards now work in more or less the same way. The Time Window To Display option that we set to 1 Second above can be used to control the number of copies of the pushed table that are displayed. For example, setting it to five minutes shows data from all of the copies of the table pushed in the last five minutes:

[Incidentally, if you’re using the Power Query query above you’ll see that every time the query runs, the web service is actually called twice! This is a feature of Power Query and M in general – there’s no guarantee that the web service will be called just once even if the query itself is executed once. This is why the dev team always tells people never to use Power Query to update data in a data source (see here for another example of this)]
You now also get a new option to create a report from a streaming dataset on the Streaming Data screen – you need to click the small graph icon next to the name of the streaming dataset:


So now you can create reports that show how the data in your Excel table has changed over time, and slice by the values in the UpdateDateTime field:

It’s important to realise that unlike the dashboards, reports connected to a streaming dataset don’t refresh automatically – you have to click the Refresh button on the report.
Conclusion
Although the examples in this post are perhaps not all that practical, hopefully they show what’s possible with the streaming API and some M code. It would be great if we could do data modelling-type stuff like add measures in the web interface, in the same way that we can in Power BI Desktop, because that would open the door to doing even more cool things with streaming data.


Instead of immediately “Displaying data in a Power BI dashboard” do you see any way of using that streaming dataset as datasource in another powerquery ? I’m thinking of situations where we have data in an excel sheet on a location that is not directly accessible by power bi (for ex on a pc) and from time to time we would like to update that data and send it to our powerbi report to use in calculations,selections, …
Even if your Excel workbook is on a PC, you can still install the Power BI Personal Gateway (https://powerbi.microsoft.com/en-us/documentation/powerbi-personal-gateway/) to connect to it, I think. That’s a lot less complex than the example I have here, although you are a lot more limited in your refresh options. In any case, I don’t think you can use a streaming dataset as a data source for Power Query. You don’t even seem to be able to connect to a streaming dataset using Analyze in Excel.
Excellent, Thank you.
I’m testing Performance Counts from PowerShell script to Power BI Service’s streaming dataset each 2 seconds, and create Q&A reports.
and also I’m test some data from Microsoft Flow to Power BI Service’s streaming dataset.
I’m looking for more scenario’s.
Reblogged this on Power Blogger BI and commented:
Very interesting Article!
Hi,
I can use the line chart and Q&A for Streaming dataset,
by adding “Date” column to Excel Table, which value is “=NOW()”,
and sending the “Date” column with other data to Power BI Service.
Regards,
Yoshihiro Kawabata
Yes, it’s quite easy to modify the M code to send the date as a column – the problem was the format of the date as it was displayed in a slicer, and that’s why I converted it to text.
I’ve been struggling with this for a few hours now! I followed exactly all the steps until PowerQuery, copied the M code but as a result I get the following error:
Expression.Error: The column ‘Month’ of the table wasn’t found.
Details:
Month
Do you have an idea of what’s going on? I’m using Excel 2016
I share that
“reports connected to a streaming dataset don’t refresh automatically”,
BUT Pinned visuals to dashboard from reports connected to a streaming dataset refresh automatically.
now I enjoy “Tweet real-time monitor about “Microsoft Flow” by Microsoft Flow and Power BI”
https://powerusers.microsoft.com/t5/Flow-Forum/Tweet-real-time-monitor-about-quot-Microsoft-Flow-quot-by/m-p/21129#U21129
Regards,
Yoshihiro Kawabata
Hi Chris, This is really easy way to visualize real-time date in Power BI. Do you have copy of excel and Power BI report for “Pushing Data From Excel To Power BI Using Streaming Datasets”. thanks
hello, can this be done using power bi desktop instead of power query in excel?
Yes, the code will be almost exactly the same although you will have to get your data from an external data source.
Hi Chris,
This solution seems to work only with Office 2013 and 2010. How about Office 2016?
It should work fine in Excel 2016. What’s the problem?
I try to filter my weekly reports (xml, csv, xls – files) with Power Bi Desktop and post results to power bi service using streaming dataset. The reason why I do this instead directly uploading .pbix to the cloud is that the reports do not include history data which streaming dataset seems to offers.
However PowerBi query doesn’t like the step ‘SendToPowerBI’. It gives an error
‘SendToPowerBI’ references other queries or steps, so it may not directly access a data source. Please rebuild this data combination.When trying first time, It also asked me the level which anonymous authentication should be applied, I didn’t knew what to answer so I selected api.powerbi.com etc. Now I’ll get response 404 every time.
It sounds like you need to disable data privacy checks: https://blog.crossjoin.co.uk/2017/07/04/data-privacy-settings-in-power-bipower-query-part-4-disabling-data-privacy-checks/
Thanks Chris,
I got this working in excel but not with Power BI Desktop. I found the option to remove credentials in Excel and created streaming dataset from scratch from Power BI service. I don’t know which one solved the jam, but now it works with anonymous account.The latest data looks ok in the dashboard but report shows duplicated data. Is there possible to filter data in the report so that it won’t sum duplicates which Excel sends (seems that during post Excel sends everything twice)?
I might have the wrong aproach, because I need to collect data from .csv and .xls files to my reports weekly and keep the old data at the same time (the system where the data comes does not keep history). The streaming dataset seems quite dangerous to try to keep data. Is it possible to keep history data in Excel and post all periodically to the Power Bi service not just latest? How to draw report in this scenario?
Personally, I would not use the streaming dataset approach in this case because it can only store a certain amount of data. Why not just keep all the csv and xls files in two folders, and then use the From Folder option to load all the data from all of the files?
great article but im totally lost … I use Excel 2016 (Office 365) … these instructions arent suitable from what i can tell … any chance this article can be updated for Excel 2016?
Everything here should work in exactly the same way in Excel 2016. What are you having problems with exactly?
Hey Chris, thx for replying … im a bit of an amateur and have obly discovered Power BI in the last 2 days! I tried to follow your instructions above but got lost at the Power Query Query Editor window … a quick search and i discovered that Excel 2016 has a totally different path / component – so being a newby and not a programmer, i had to put down the tools. If you do have Excel 2016, it would be great if you can follow your process and see if you get the same hiccup. If so, id love an updated process as id have absolutely no chance of getting this to work! … thx in advance
Hi Michael, you can open the Power Query Query Editor window in Excel 2016 by going to the Data tab in Excel and clicking the Get Data button – somewhere underneath there (it varies depending which version of Excel 2016 you have) there will be a menu option to “Launch Power Query Editor” or “Launch Query Editor”.
One other thing Chris … for what its worth and im probably looking at the wrong thing here .. i have an Excel spreadsheet that has live financial data constantly updating .. id like to be able to use Power BI to view this data streaming straight from excel without having to save or refresh Excel or Power BI … is this possible?
It might be but it will depend on how the live data is getting into Excel in the first place. You’re probably better off connecting Power BI directly to the source of your live data rather than going via Excel.
Chris … yep got it! … Excel 2016 … Data > Get Data > Launch Query Editor … thx Chris, im going to have another crack at this tomorrow
The Live data im referring to is from the Bloomberg Desktop API. It feeds directly into Excel. From there, i use it raw but also have many calculations that create rich data foir my own use. Im really excited to see Power BI functionality and visuals, the UI is brilliant. So for my own purposes ideally this data could stream into Power BI – mostly from Excel given that i manipulate it but directly from Bloomberg if thats an option. The Bloomberg license only allows me to use their data on a device where my Bloomberg terminal is logged into, and i can only be logged into one device at a time – so given that there is no desire to make the Power BI visuals available or shared with anyone else. Is any of this possible without having to save or refresh Excel & Power BI?
Hi Chris, i had another crack at this … sorry but cant get it to work.
Hello, i’ve been struggling to create some real-time data dashboard with powerbi using excel. Glad to come across this article, it’s great! However, I had followed your instructions exactly for every steps but after loading the query, the updated date and time did not reflect on the excel, it shows the full set of query details instead. Anyway, I continued, and I managed to go all to the till adding a tiles but same thing, nothing is showing. I tried creating something with the data under the dataset heading, nothing is show except the column heading. Do you know what went wrong here?
Sorry, I don’t know. Can you explain what you mean by “the updated date and time did not reflect on the excel”?
Hi, I mean the part where it shows the “status” on first row and the following row saying “data updated successfully at DD/MM/YYYY, time”.
Hi Chris, thanks for your post, but i’m frustated that i can’t display totals (sum, average, max) from the table. I added a second table in Excel with sum and average and added to powerquery (i created a second powerquery and a new PowerBI Stream) and i tried to add a card in powerbiservice but he displays…nothing ! have an idea how to display sum or average ?
Hi Chris, i found how to display stats (like measures) : just create a table with headers (sum, average, etc…), write excel formulas for sum… and send this table to power bi, on the same dashboard and you have cards with values !
Hello Cris, thanks for this article.
I’ve had a bit of trouble trying to get it to work – would you be able to make a video of you setting this connection up? If you could that would be great!
Hello Cris, I am doing step by step what you wrote but It returns error related to credentials from API data source.
What type of credentials are recommended in this case?
Great Article I followed the exact step But I keep on getting a error after writing the code. Unable to retrieve data can you please help.
So I resolved that issue. I followed Each and Every Step . In excel it displays data updated successfully. However it is not getting displayed in the Power Bi work space after I added a tile. Please help
Hi! This works perfectly with the data in the example. I’m trying to replicate this but using a table created from an ODBC and is not working. I’ve already disable data privacy checks, I’m accesing to the endpoint anonymosly but it keep sayng “Failure at (date time)”. Any ideas that may work?
Hi Chris. Thank you very much for the great tutorial! In the beginning it had some struggle to update the data, but now in 2022 it still works great!
Would you have an idea to make a update so that the query also works in Excel Online? Now it doesn’t work. Maybe in the new script tools if Excel online?
That could be a great addition now the online Excel is also developing fast with more options.
Would love to hear from you. Best regards, Jeroen